Insights and reporting of Conditional Access policies
👋 Introduction
Conditional Access policies play a key role in keeping your organization's resources secure in Entra ID. Keeping an eye on these policies helps ensure they're doing their job and gives you valuable insights into their effectiveness.
In this guide, I'll show you how to set up the reports with Log Analytics Workspace and diagnostic settings to monitor and report on these policies.
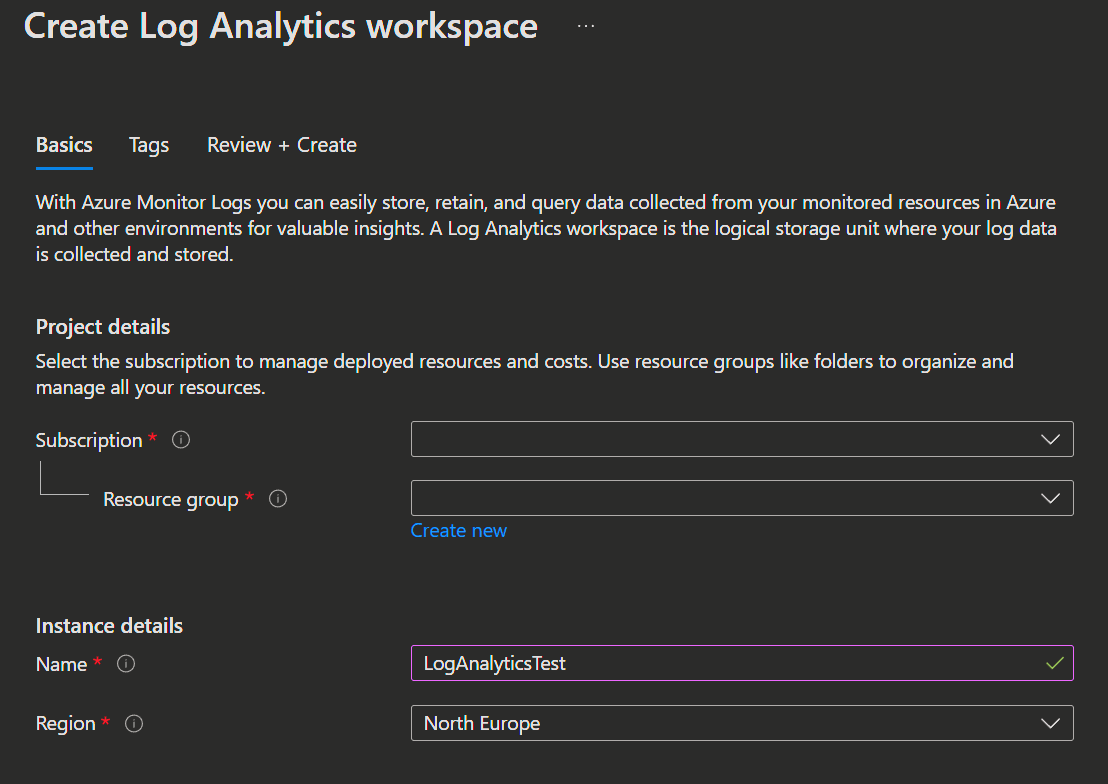
1. 📑 Create a Log Analytics Workspace
- 1. Open the Azure Portal and select Log Analytics.
2. Click 'Create', enter your Name, Resource Group, Region and click 'Review + Create'.
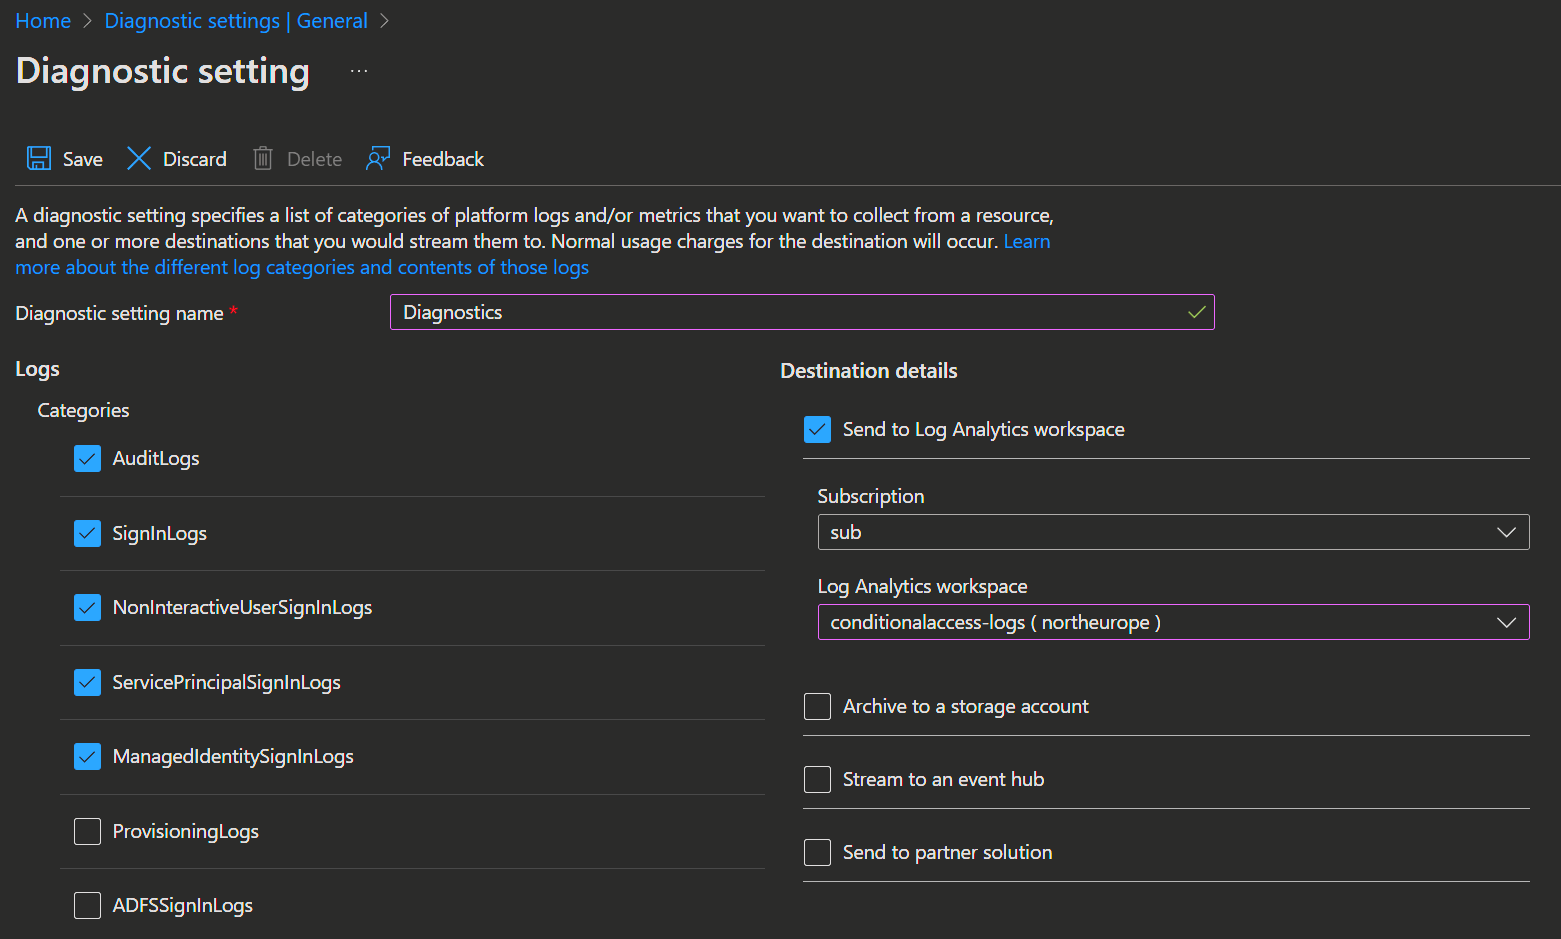
2. 📈 Create Diagnostics Settings
- 1. Open the Entra Admin Center -> Monitoring & health and open Diagnostic settings.
- AuditLogs
- SignInLogs
- NonInteractiveUserSignInLogs
- ServicePrincipalSignInLogs
- ManagedIdentitySignInLogs
2. Click 'Add diagnostic setting', enter your settings name and select the following Categories:
4. And finally select 'Save'
NOTE
Beware that you can only add 5 diagnostics settings in your tenant.
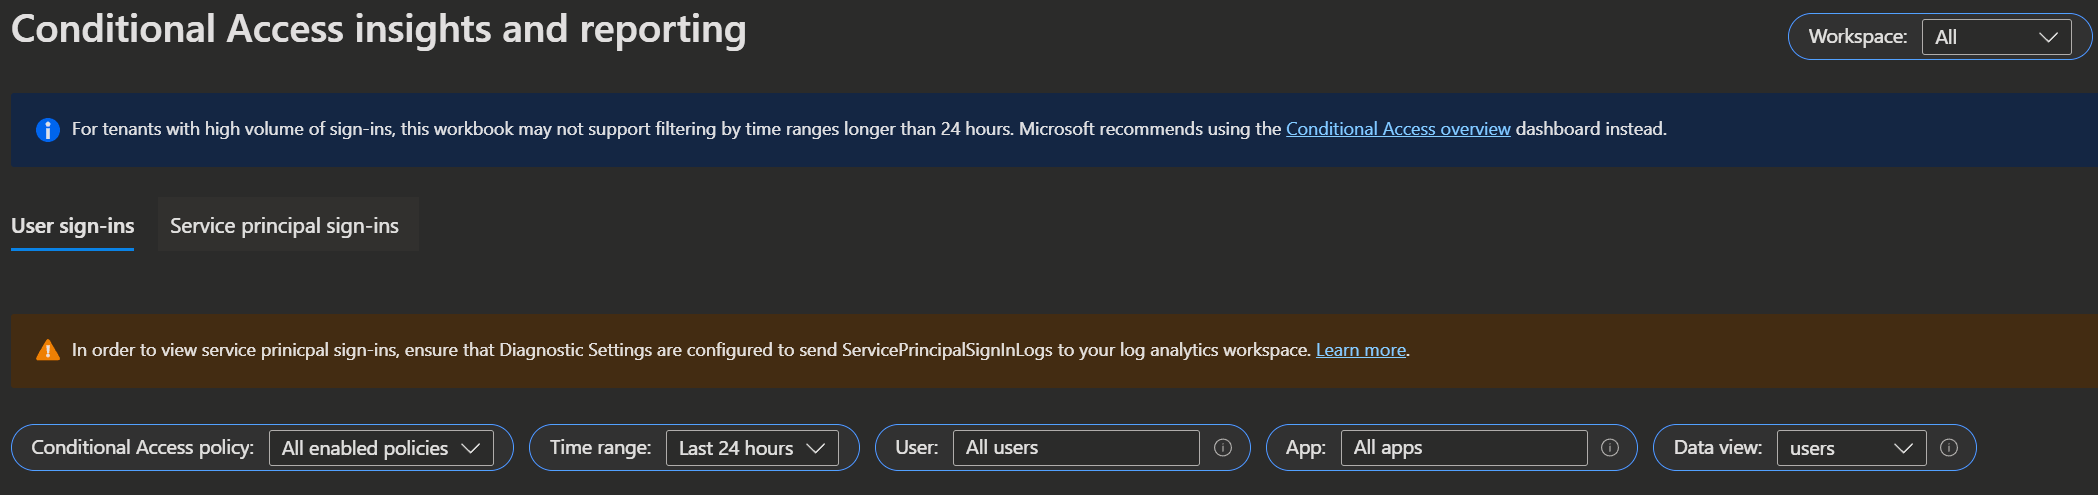
3. 📒 Insights and reporting
IMPORTANT
It can take some time until the information will show in the reports and until you get meaningful insights from it.
- 1. Open the Entra admin center -> Protection -> Conditional Access and select Insights and reporting.
- User sign-ins
- Service principal sign-ins
- Conditional Access policies
- Time Range (Last 30 Minutes to Last 90 days or use a custom range)
- Users
- Apps
- Data views
- users
- sign-ins
2. Here you can find the information about your Conditional Access policies.
You can organize and sort the entire data based on the following sign-ins:
You can also filter the whole dataset using the following criteria:
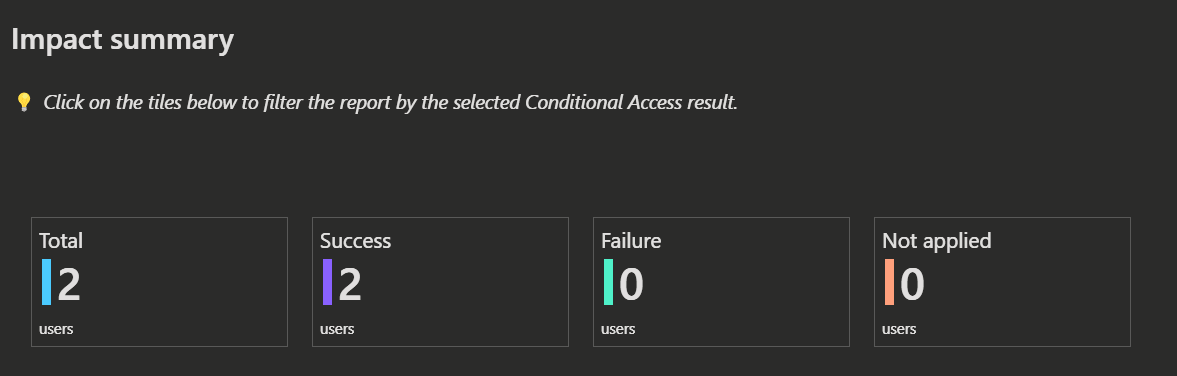
- Total
- Success
- Failure
- Not applied
In the Impact summary, you can view the total number of sign-ins, including successful and unsuccessful attempts, as well as instances where Conditional Access policies were not applied. Additionally, you can click on the counts to drill down into the corresponding pie charts for more detailed insights.
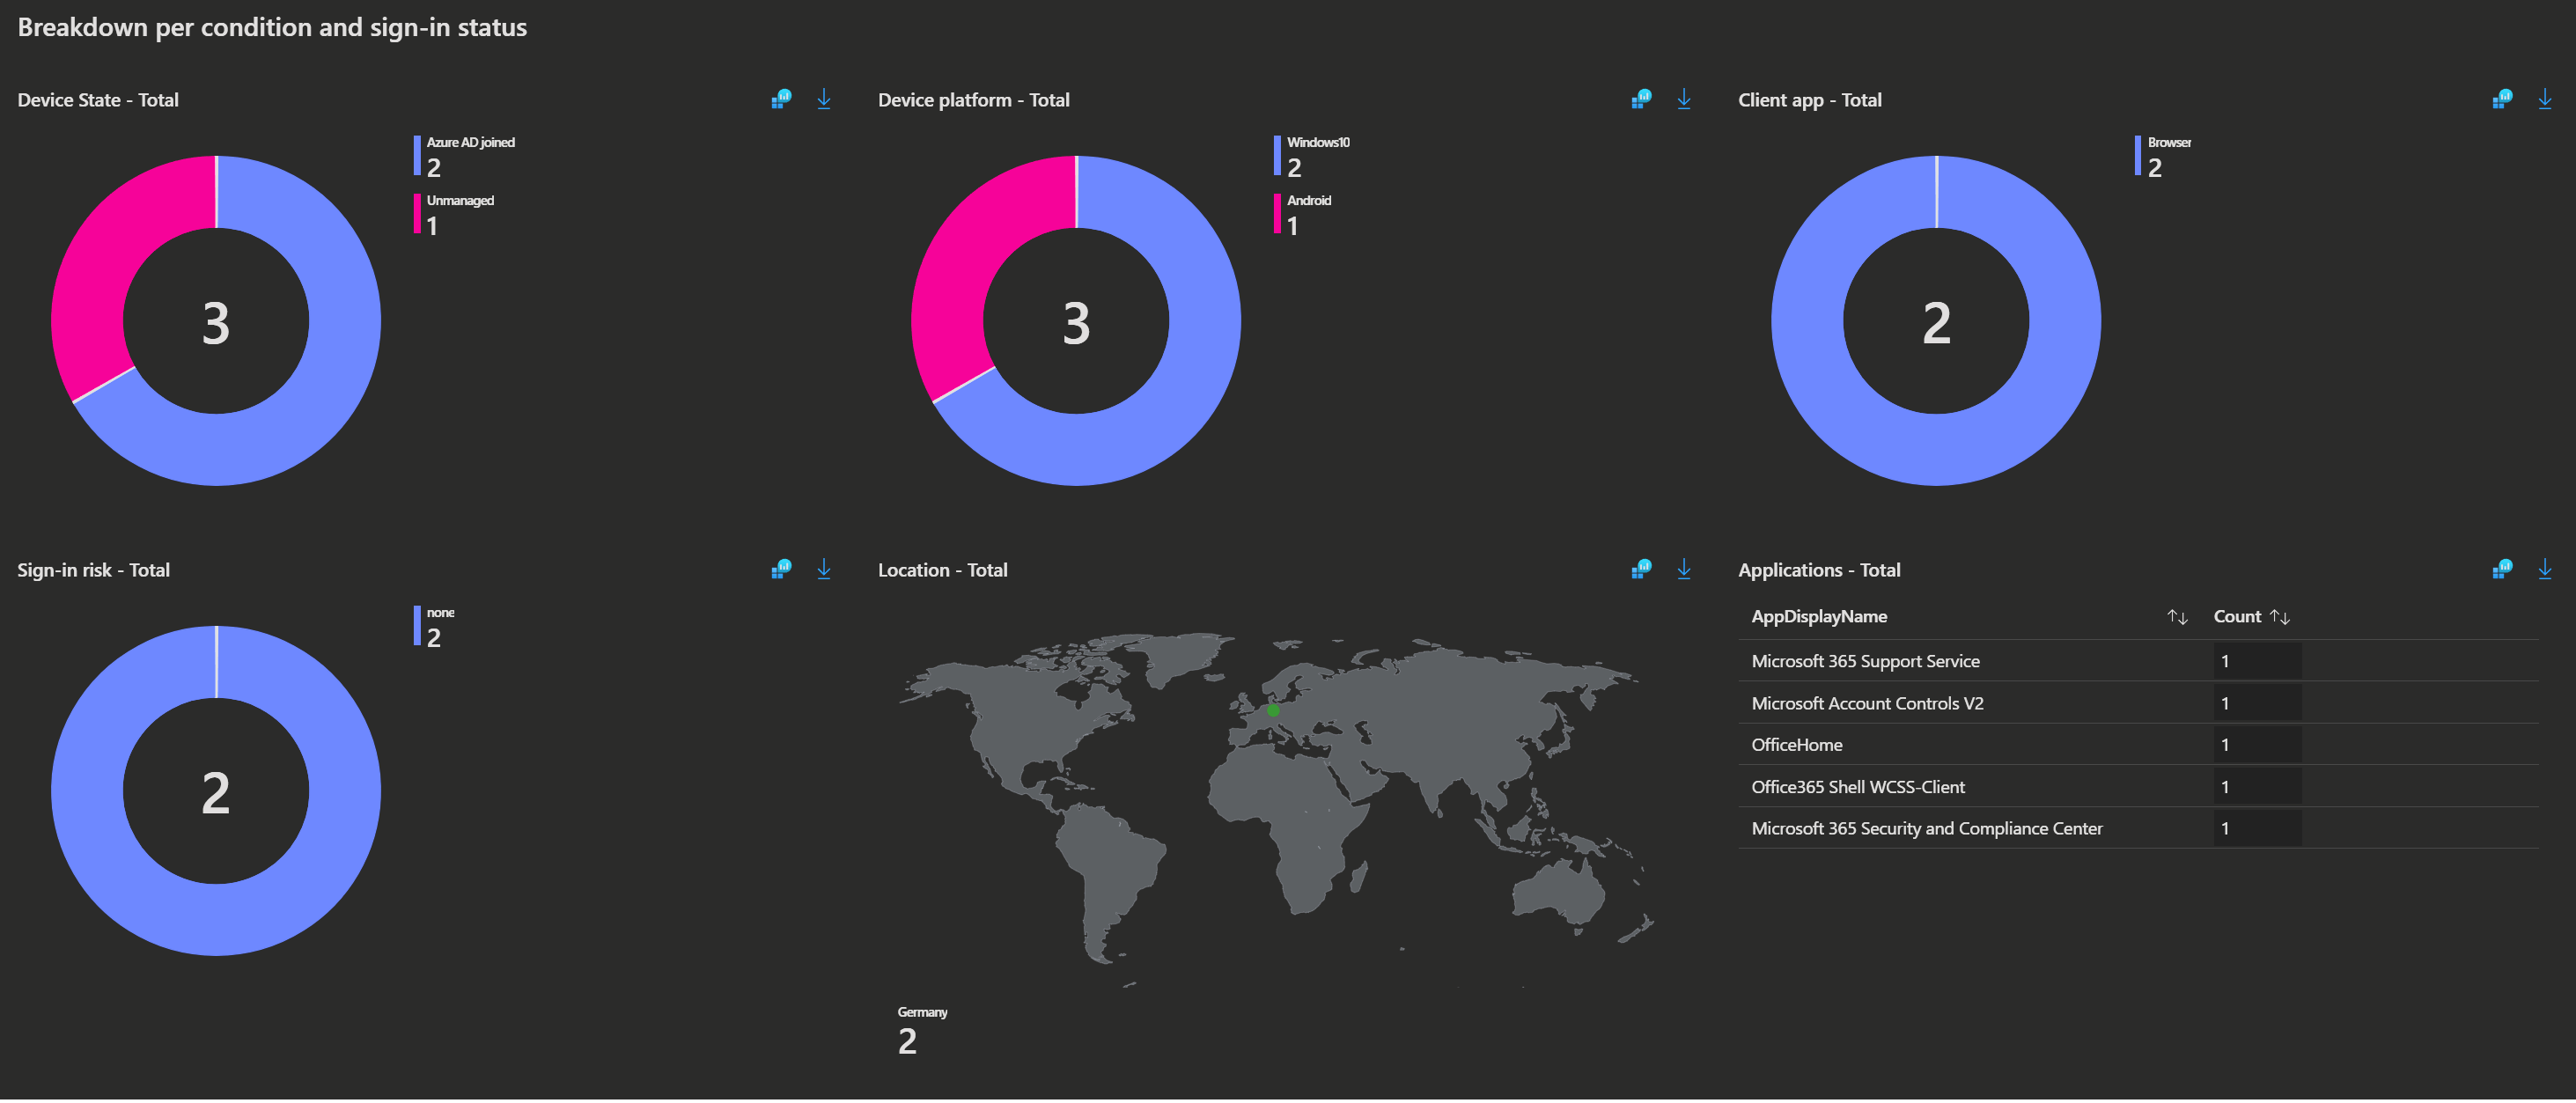
- Device State
- Device platform
- Client app
- Sign-in risk
- Location
- Applications
Below the Impact summary, you will find the Breakdown per condition and sign-in status. This section provides pie charts and an overview of the countries and applications associated with your users or sign-ins.
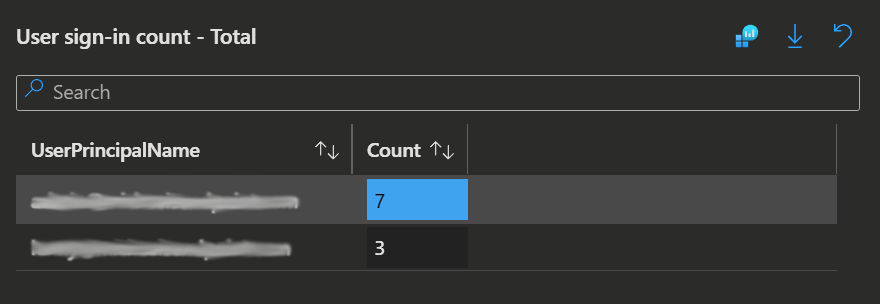
- User sign-in count
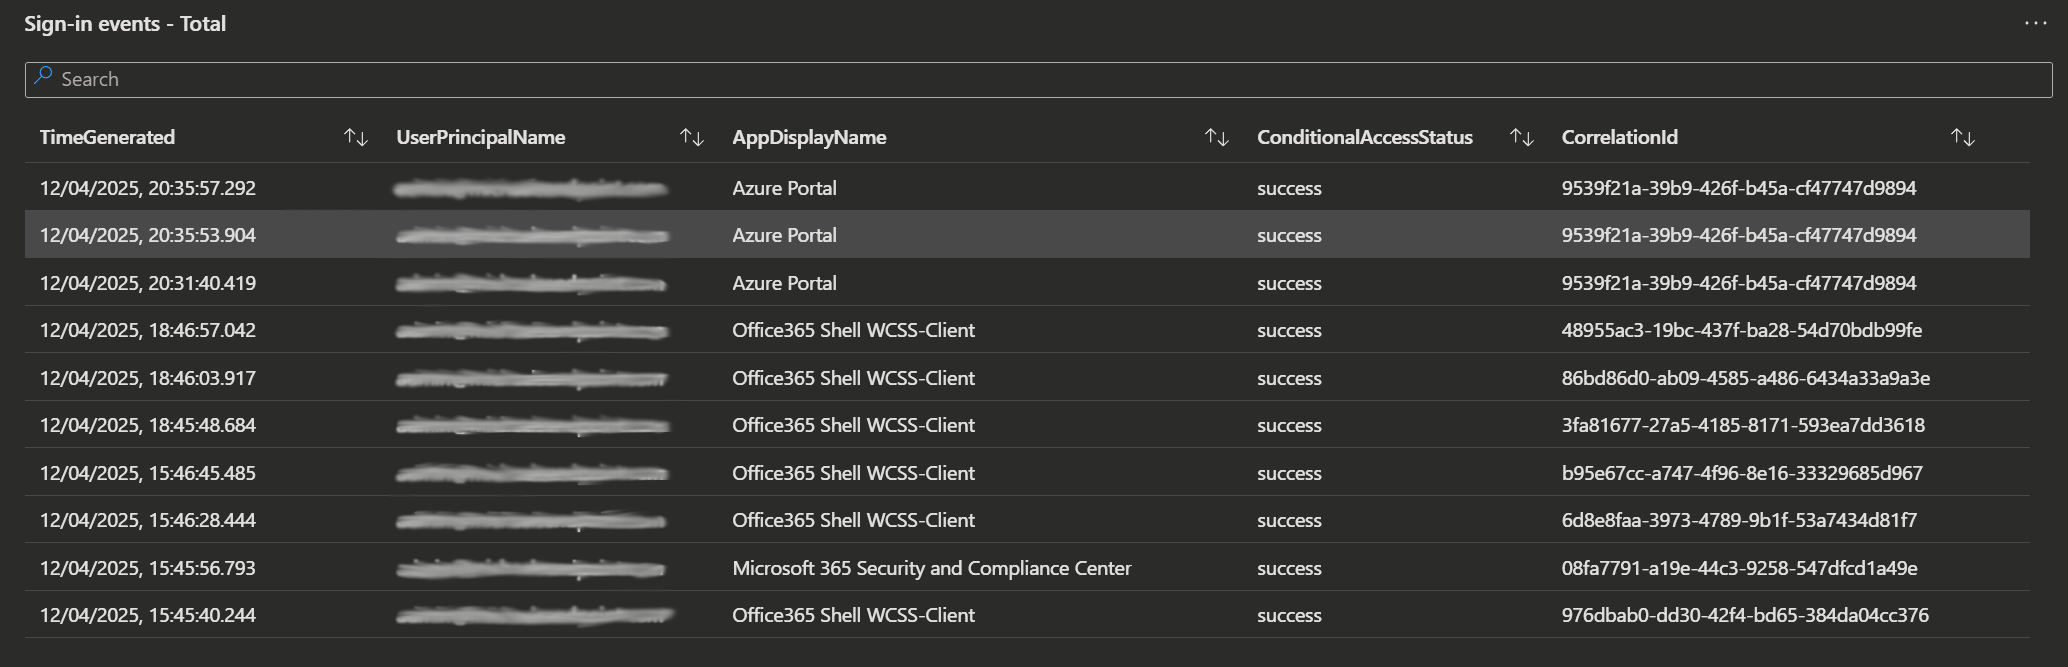
- Sign-in events
And below that, you can explore detailed insights about your sign-ins in the Sign-in details section.
💡 Conclusion
Monitoring Conditional Access policies is key to keeping your organization's resources secure in Entra ID.
The steps above make it easy to get a clear picture of how your policies are working and help you roll out new ones with confidence.
With report-only mode, you can test out new policies without enforcing them right away, and the detailed data lets you see exactly how they're performing.
By using Log Analytics Workspace, diagnostic settings, and the Insights and Reporting tools, you’ll have everything you need to stay on top of policy performance, user activity, and potential security issues.