
Advanced Analytics
👋 Introduction
Advanced Analytics enhances Intune’s standard reporting by providing deeper insights, near real-time data, and more robust monitoring capabilities. It gives you a clear view of how your users are experiencing their devices and helps you improve with smart, data-driven insights. You can spot and fix endpoint issues before they become big problems, troubleshoot faster, and make sure your users have a smooth tech experience.
Here’s what you get with the Advanced Analytics features:
- Custom device scopes: Filter Endpoint analytics reports using Scope tags to focus on specific devices, groups, or locations. Get targeted scores and insights for just those devices.
- Anomalies: Keep an eye on device health and catch any dips in user experience or productivity after making changes. This helps you react quickly if something goes wrong.
- Enhanced device timeline: Get more events and fresher data to help you troubleshoot device issues faster.
- Device query: Check up on the state and configuration of devices almost in real time, so you’re always in the loop.
- Battery health report: See how hardware performance like battery issues might be affecting your users.
📝 The Basics of Intune analytics
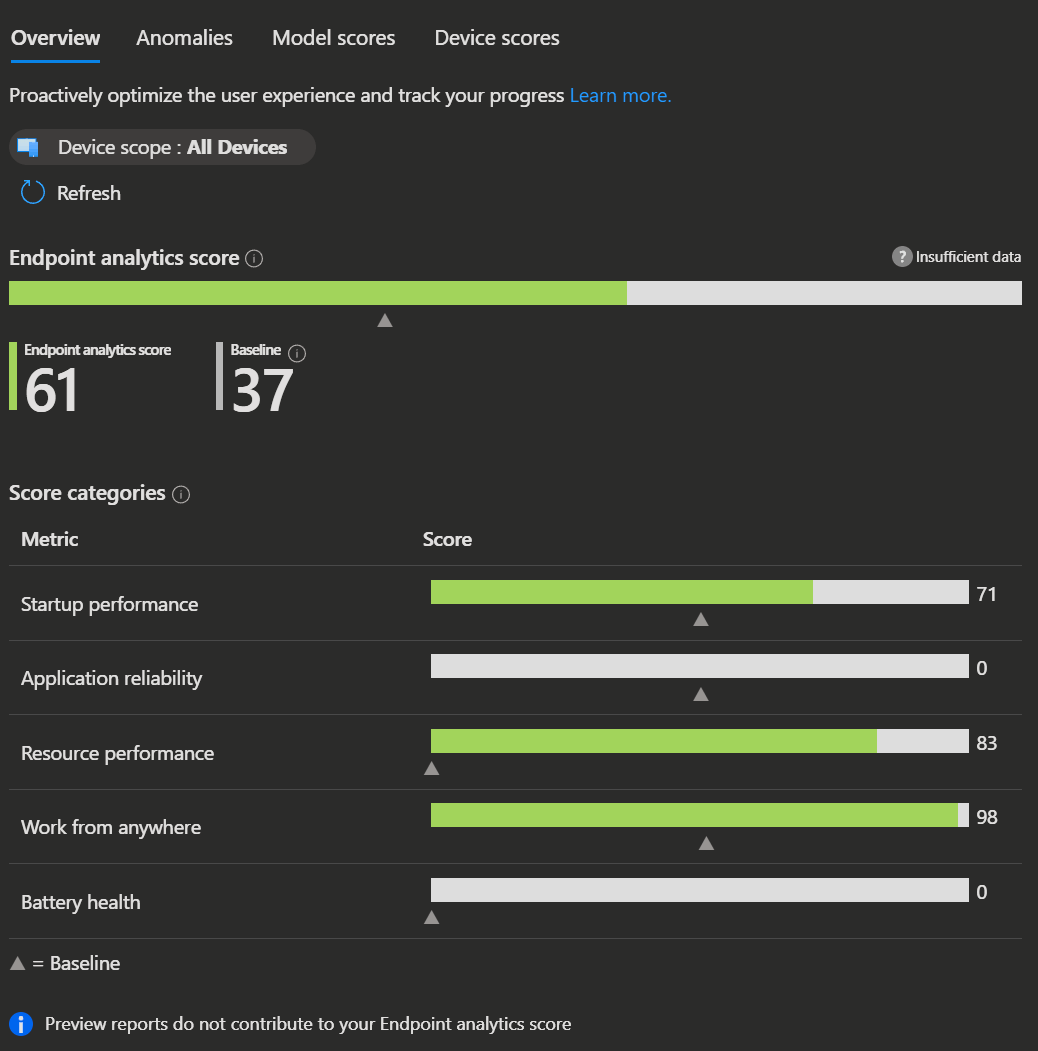
Scores
Endpoint analytics scores go from 0 to 100, giving you a quick way to see how your environment stacks up. These scores show how each metric affects your setup and let you compare your results to the average across all organizations so you can see where you’re ahead or where there’s room to improve. You typically receive analytics scores broken down by device, device model, and other relevant groupings. This granularity helps you identify trends, pinpoint issues, and compare performance across different segments of your environment.
Baselines
Baseline scores are the averages against which your organisation is measured, as discussed in the Scores section above, and are shown on charts as triangle markers. Think of these as built-in median scores from all organizations, handy for seeing how you stack up. You can also set up your own baselines using your current numbers, making it easy to track progress or spot any backslides over time.
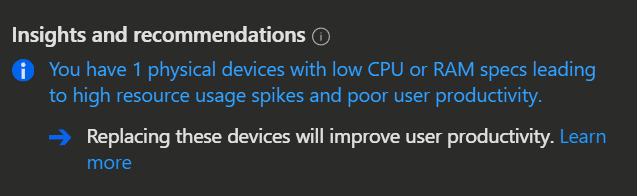
Insights and recommendations
Insights and recommendations give you a handy to-do list for boosting your score. You’ll see a list right on the reports overview page and as you dig into different report sections, the suggestions update to match what you’re looking at.
- Clicking the insight link under Insights and recommendations gives you detailed information about the devices and attributes associated with that insight.
- The Learn more link explains how the metric is scored and outlines recommended actions to address the insight.
INFO
You can find more information about known issues of these basics here.
✅ Prerequisites for Intune analytics
Device
- Windows 10 version 1903 or later
- Microsoft Entra joined or Microsoft Entra hybrid joined
- Intune-managed or co-managed devices
- The 'Connected User Experiences' and 'Telemetry' services on the device is running
- The endpoints need to reach:
https://*.events.data.microsoft.com - Set an Intune data collection policy in your configuration profiles under the Windows health monitoring template
- Give your consent to the Intune data collection policy in the Endpoint analytics settings
Licenses
- Intune license
- Intune suite license or Endpoint analytics standalone license
Enabling Advanced Analytics
When license requirements are met, then Advanced Analytics features are automatically enabled in your tenant.
Mixed licensing scenarios
If some users have Advanced Analytics and others just have the basic Intune license, that's a mixed license setup. Right now, everyone gets access to the most advanced features available in your tenant. So if anyone has the add-on, those features show up for all devices.
Permissions
- You need an Intune Service Administrator or a Global Administrator role to activate the gathering of data
- You need one of the following roles to read the endpoint analytics
- Endpoint Security Manager
- Help Desk Operator
- Read Only Operator
- Reports Reader
🧑🔧 Configuring Intune analytics
Intune data collection policy
- Open the Intune admin center → Devices → Configuration
- Now click
Create,New Policyand after selecting the Platform and Profile type,Createagain.- Platform: 'Windows 10 and later'
- Profile type: Select 'Templates' and 'Windows health monitoring'
- Now enter the 'Name' and 'Description' of your Policy and click
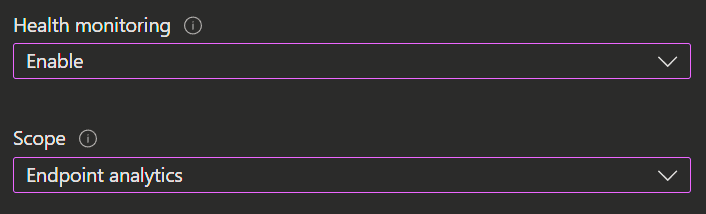
Next. - Now you select to enable the 'Health monitoring' and 'Endpoint analytics' as the Scope.
- Finally configure your Assignments, Applicability Rules and create the policy.
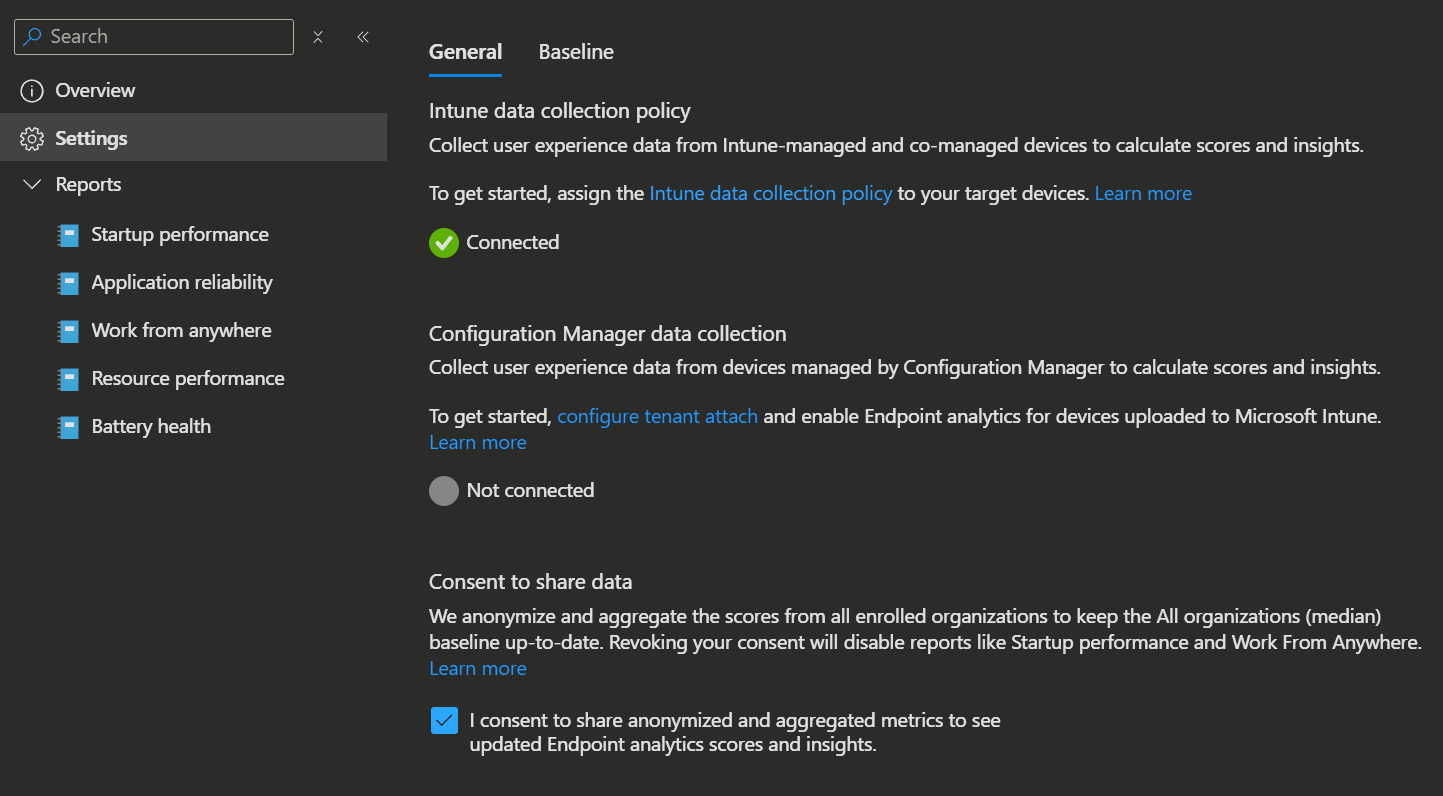
Data sharing consent
When you agree to share your anonymized data, your organization helps keep the baseline fresh and up to date. Without agreeing you will not be able to take advantage off reports that depend on this data, like the startup performance insights. If you consentet before and revoke your consent again, reports will turn off too, but old data will stick around for 60 days.
- Open the Intune admin center → Reports → Endpoint analytics → Settings
- Consent to the Intune data collection policy and to Consent to share data.
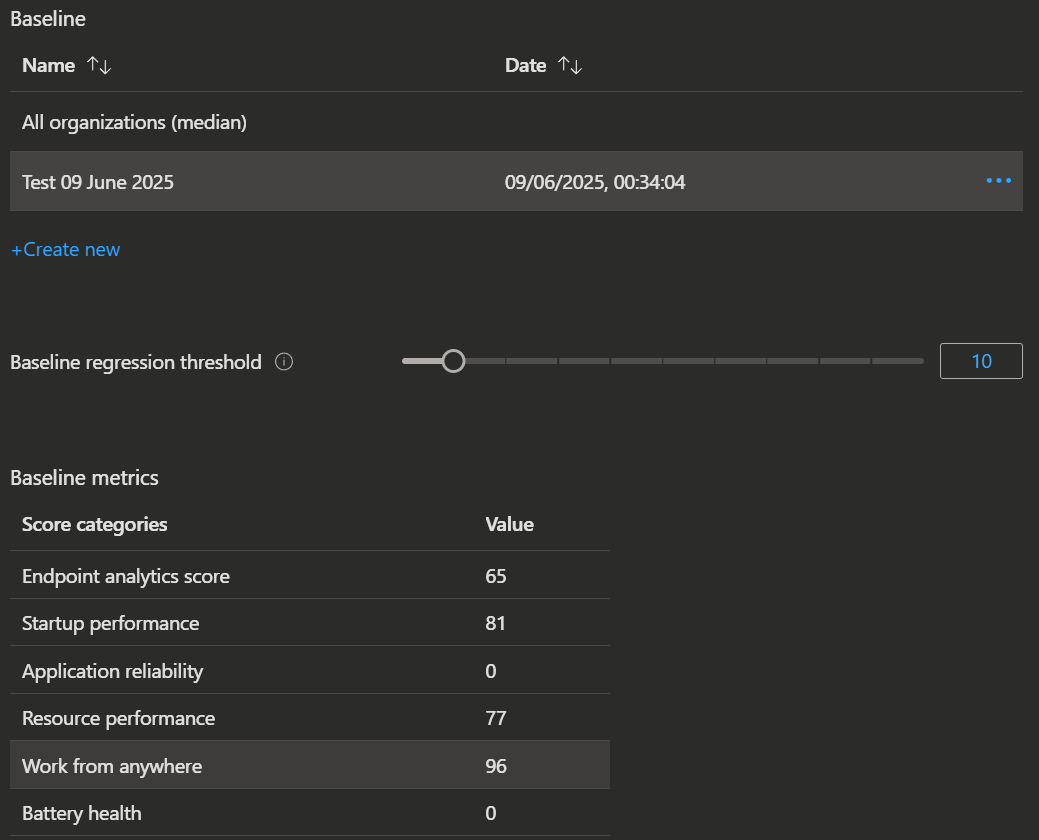
Baseline configuration
You can set your current scores as a new baseline and compare to them later.
- Open the Intune admin center → Reports → Endpoint analytics → Settings and open the Baseline tab.
- By clicking
Create newyou can create new baselines based on your current metrics to track progress or view regressions over time.
NOTE
- You must open at least one Endpoint analytics report, such as Startup performance, during your browser session before you are able to create a new baseline.
- There's a limit of 20 baselines per tenant.
📑 Advanced analytics reporting
To access Intune analytics reports, go to the Intune admin center, select Reports, and then choose Endpoint analytics.
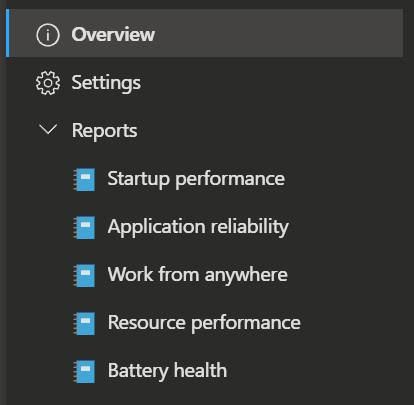
See all available endpoint analytics reports
Overview
- Overview
- Anomalies
- Model scores
- Device scores
Startup performance
- Startup score
- Model performance
- Device performance
- Startup processes
- Restart frequency
Application reliability
- Model performance
- Device performance
- OS versions performance
Work from anywhere
- Overview
- Model performance
- Device performance
- Windows
- Cloud management
- Cloud provisioning
Resource performance
- Resource performance score
- Model performance
- Device performance
Battery health
- Overview
- Device performance
- Model performance
- OS performance
- App impact
Anomaly detection
Anomaly detection keeps an eye on your devices and lets you know if something starts to go wrong after you make changes. If there’s a problem, it quickly connects the dots between what changed and what’s causing the issue, so you can troubleshoot faster and get things back on track quicker.
As well as identifying anomalies, you can analyse device correlation groups to determine the cause of medium or high issues. These groups show you patterns across devices, making it easier to see what they have in common. Intune also identifies devices that are 'at risk' because they fit the pattern and are likely to encounter the same issues soon.
- Open the Intune admin center → Reports → Endpoint analytics → Overview and then select the 'Anomalies' tab.
- This tab displays detected anomalies along with their severity and impact.
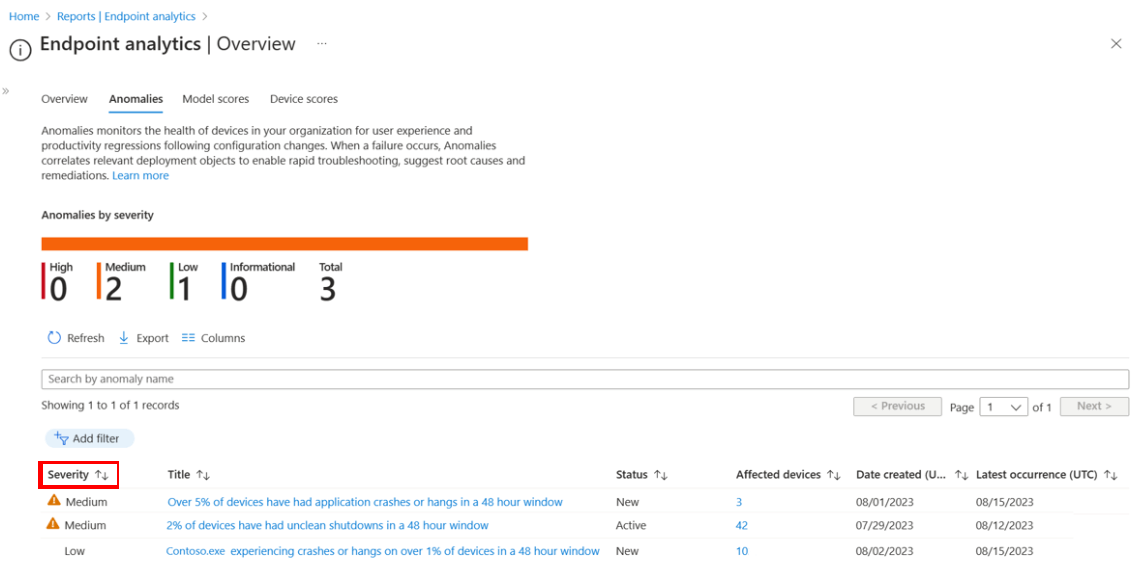
- Select an item to view details such as app name, affected devices, detection times, and related device groups.
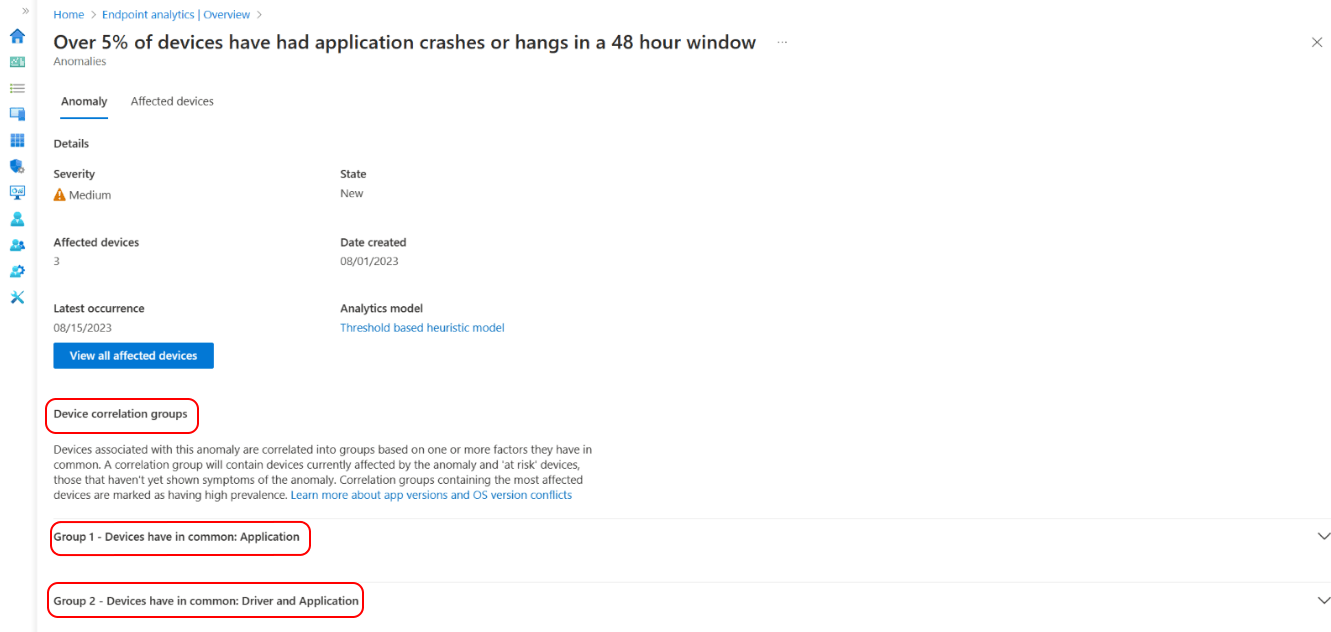
- Select a device correlation group to view shared attributes (like app version, driver, OS, or model) among affected devices. See how many devices are impacted or at risk, and the percentage of affected devices in each group.
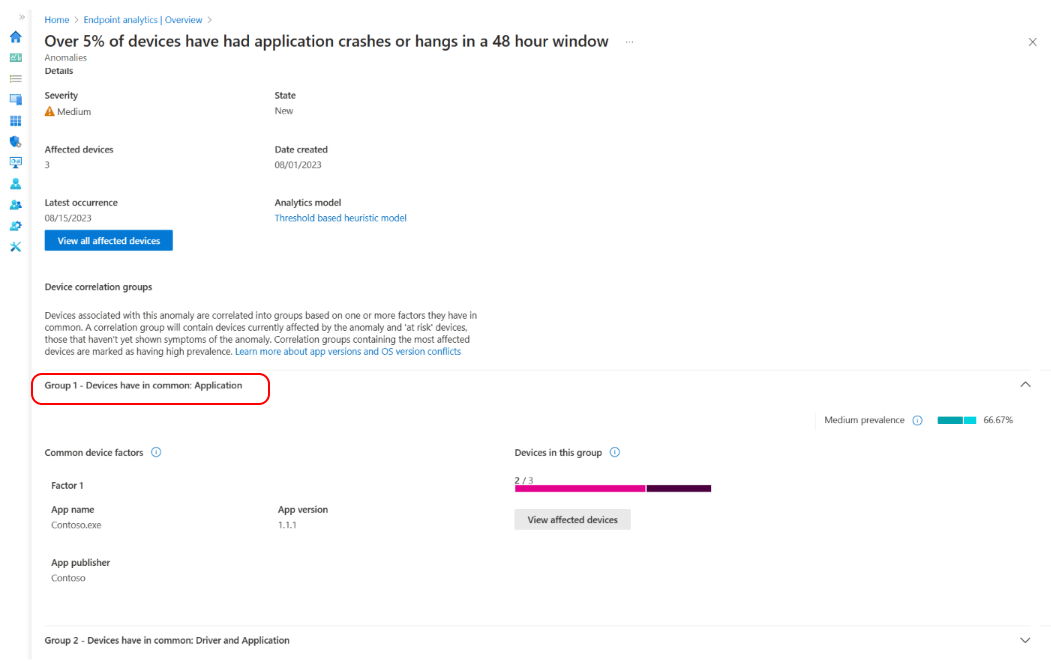
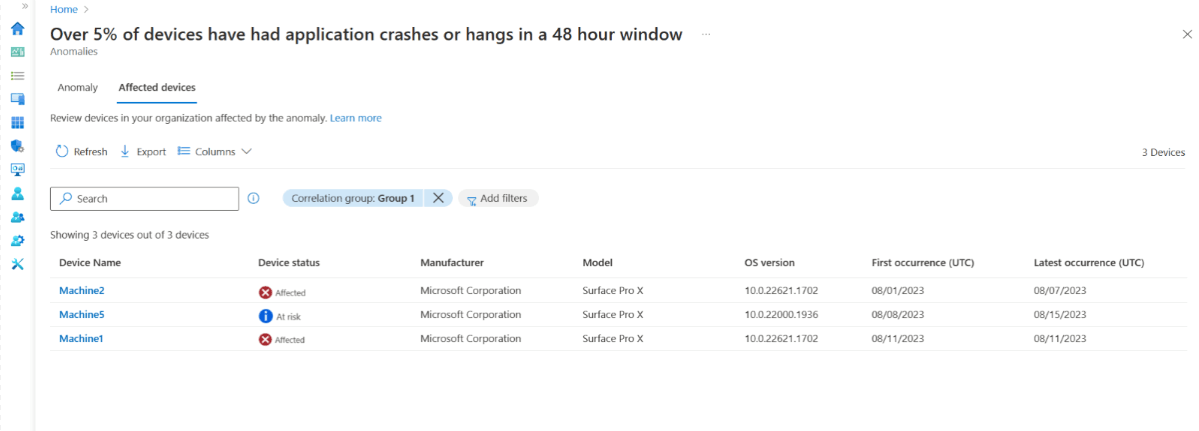
- Select View Affected Devices to see a list of impacted devices and their key attributes. Filter by correlation group or view all affected devices.
INFO
You can learn more about Statistical Models for determining anomalies here.
Enhanced device timeline
The enhanced device timeline shows you a history of events on a specific device and you can look up events by name or details.
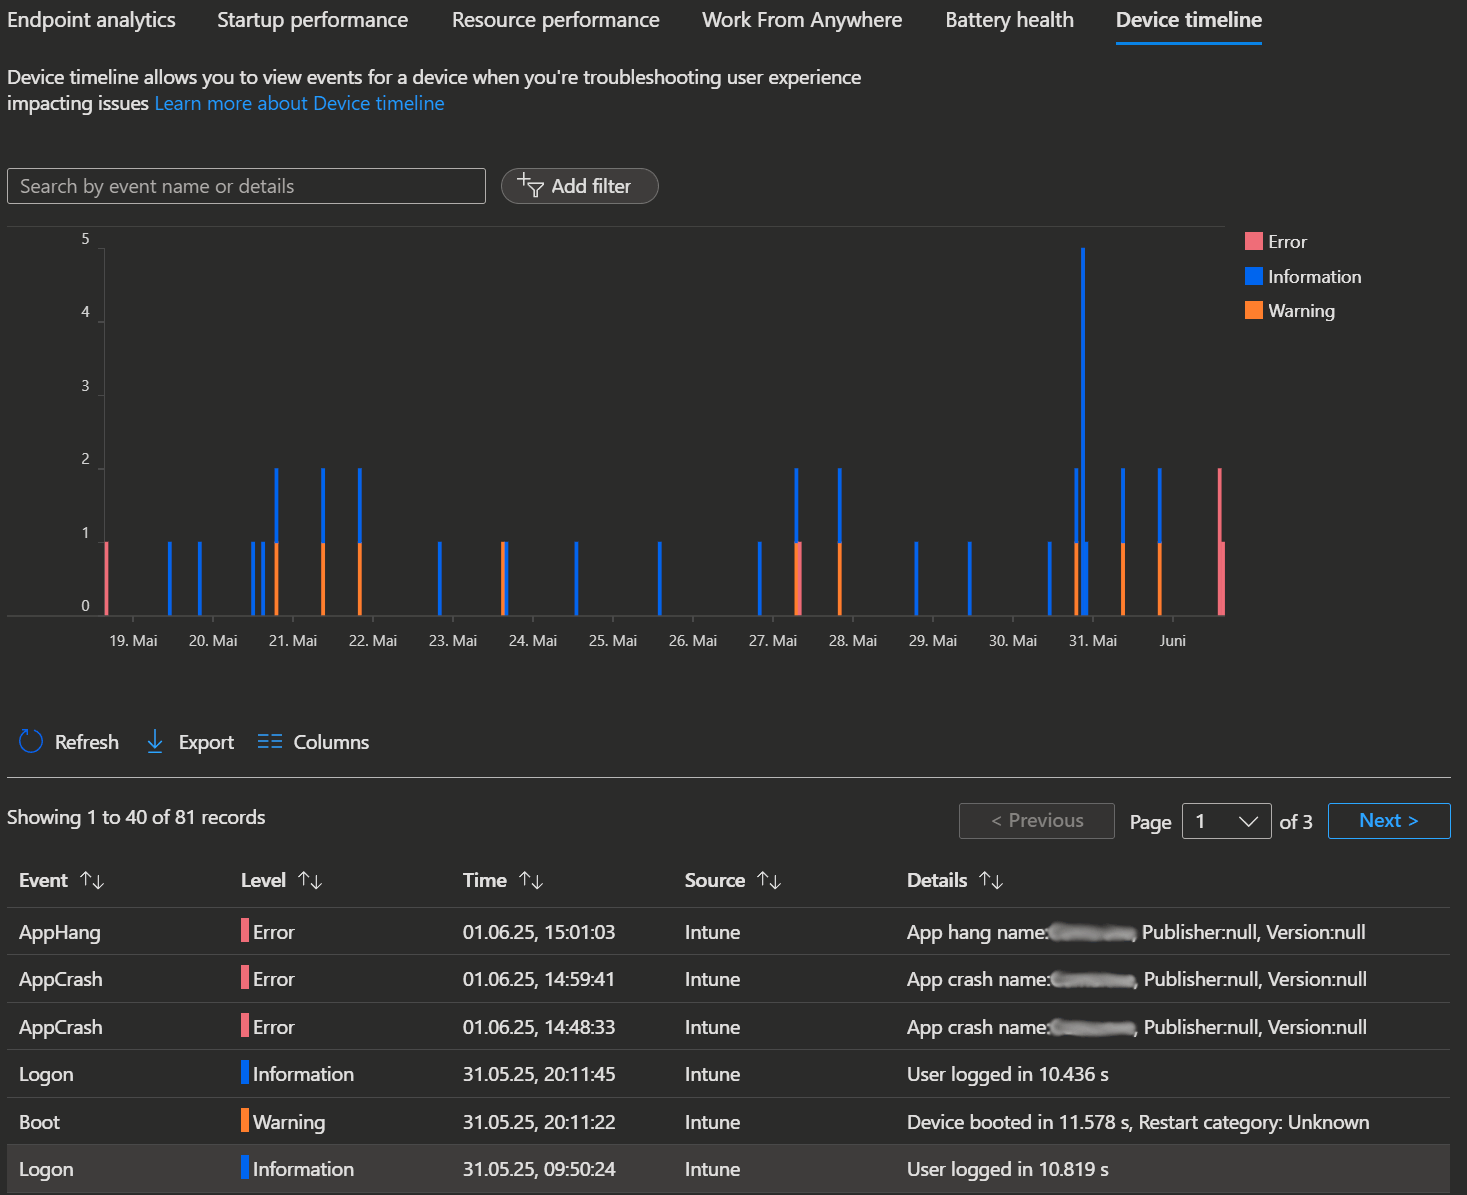
Right now, the enhanced device timeline shows things like app crashes, unresponsive apps, device boots, logons, and detected anomalies. Events will usually show up under 24 hours.
Limitations
- With Advanced Analytics, the enhanced Device timeline tab replaces the Application reliability tab in device drill-down views. To view a device's application reliability score, go to the Device performance tab and search for the device.
- The enhanced device timeline is only available for Intune-managed (including co-managed) devices.
Device scopes
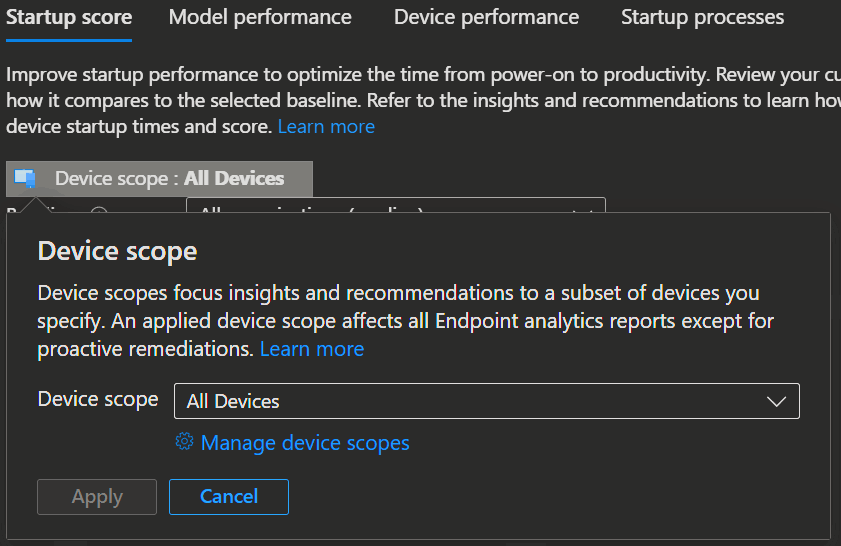
Custom device scopes leverage Scope tags to filter Endpoint analytics reports, enabling you to view scores, insights, and recommendations for targeted groups of enrolled devices.
You can use custom device scopes with these Endpoint analytics reports:
- Startup performance
- Work from anywhere
- Application reliability
- Battery health
Create custom device scope
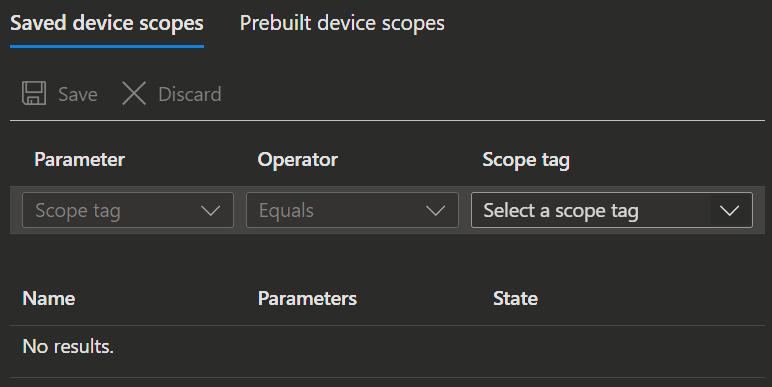
You can create and manage custom device scopes by using the Manage device scopes menu in Endpoint analytics.
- Got to to a supported report within Endpoint analytics (for example Startup performance).
- Select Device scope menu.
- Now select
Manage device scopesto open a window where you can create or edit your custom device scopes.
 |  |
|---|
You can use custom device scopes in any supported Endpoint analytics report. Once you pick a custom device scope, the page updates to show scores, data, and insights just for those devices. As you move around in Endpoint analytics, your selected device scope sticks with you across all the supported reports and pages.
Limitations
- You can save up to 100 custom device scopes, and up to 20 can be active at a time.
- Only one Scope tag can be used to create a custom device scope.
Device query and remote device actions
Device query
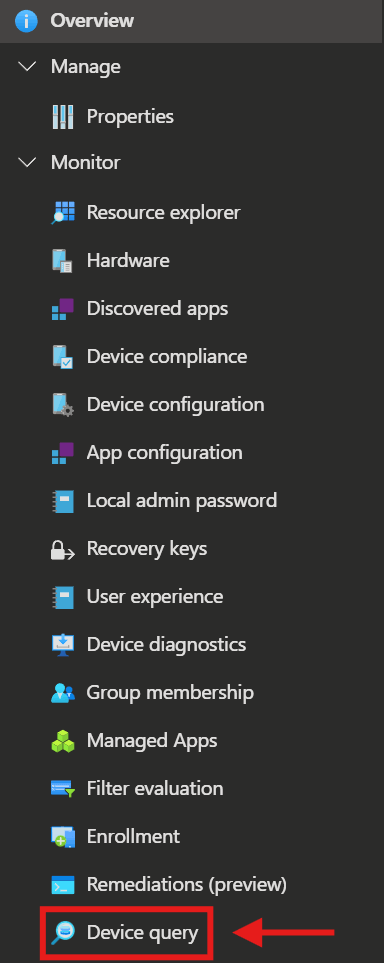
To use Device query, go to Devices in the Intune admin center and select the specific device you want to query. Under the Monitor section, choose Device query to run queries on that device.
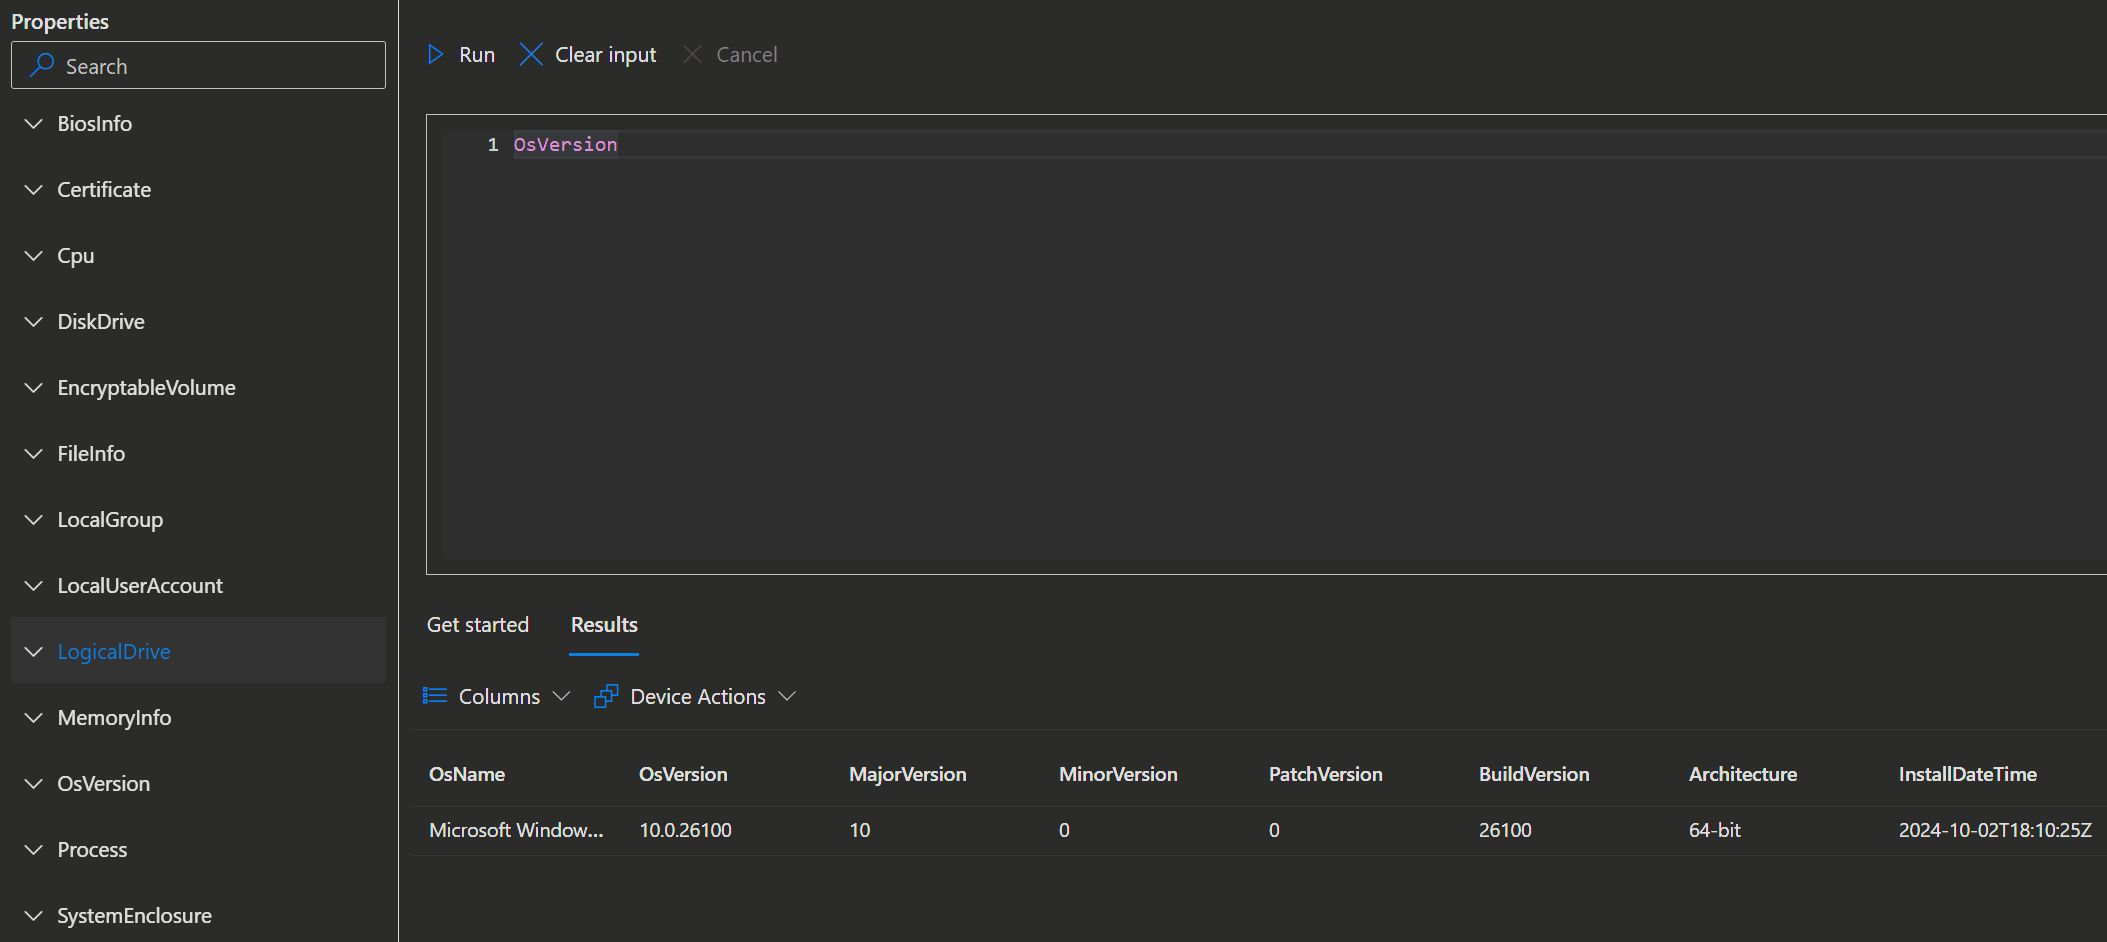
You can find the available properties for queries in the Properties section.
To execute a query, enter your KQL statement and select Run. The results will appear in the Results tab.
TIP
You can find the latest list of all available properties here.
Remote action
Use Intune remote device actions within the single device query interface to manage devices remotely. After running a device query, you can initiate remote actions directly from the results, enabling faster and more efficient troubleshooting.
TIP
You can find the latest list of all available remote actions here.
Limitations
- The result string of any query is limited to 128kb characters. If the result of your query is longer than 128kb characters, the result is truncated. An error message informs you about how many rows are truncated.
- You can only send 15 queries a minute. If you run into a query limit exceeded error, wait for a minute and try again.
- Query inputs have a length limit of 2048 characters. If you encounter a query too long error, then refine your query to have fewer characters and try again.
- The
now()scalar function doesn't support the offset parameter. - The
!likeoperator is not supported. - The input window auto-recommends double quotes when only single quotes are supported on the following operators:
contains!containsstartswith!startswithendswith
- The WindowsRegistry entity fails to return the RegistryKey for root.
- The WindowsRegistry entity fails to return 64-bit shared registry keys.
- The WindowsRegistry entity fails to return binary ValueData.
- If you’re querying devices that are running on Windows 10, they must be on a minimum quality version.
- If running Windows 10 21H2, ensure that it's running version
10.0.19044.3393. - If running Windows 10 22H2, ensure that it's running version
10.0.19045.3393.
- If running Windows 10 21H2, ensure that it's running version
- If there are multiple network cards available on the machine, then only the first configured domain is returned.
- If TPM 2.0 is present on the device, then activated and enabled is always returned as TRUE.
- If a file is currently in use on the machine, then
FileInfoqueries returns an error. - If the end user has admin access to the device, they might be able to change client-based information that show up in the query results. For example, OS version and registry.
Device query for Multiple Devices
To run a Device query for multiple devices, go to Devices → Device query, enter your query using supported properties and operators, and select Run. Results appear in the Results tab. To run only a specific query from multiple queries in the window, highlight the code and select Run.
You can find more information about creating KQL queries in the following links:
Limitations
- Using the Device entity in aggregation functions shows a red underline. However, the query can still run and can return results as expected. For example, the following query shows a red underline under Device but still runs:
Cpu | summarize max(Device) by Manufacturer.- Queries with a join operator,
$leftand$rightparameters show a red underline under$leftand$right. However, the query can still run and returns results as expected. - A single query can contain a maximum of three join operators. Queries with more joins fail.
- A max of ~50,000 records are returned for a query.
- A maximum of 10 queries can be submitted per minute. Additional queries will fail.
- A maximum of 1,000 queries can be submitted per month.
- Negative values for the amounts parameter of the
datetime_add()function aren't supported. - Referencing a variable that has been summarized by an aggregation function throws an error. Explicitly naming the variable allows the query to succeed again. For example, the query
Device | summarize dcount(DeviceId) | order by dcount_DeviceId will fail. Device | summarize DCountDeviceIdRename=dcount(DeviceId) | order by DCountDeviceIdRenamesucceeds.
INFO
To learn more about the data platform schema used in the device queries click here.
Battery health
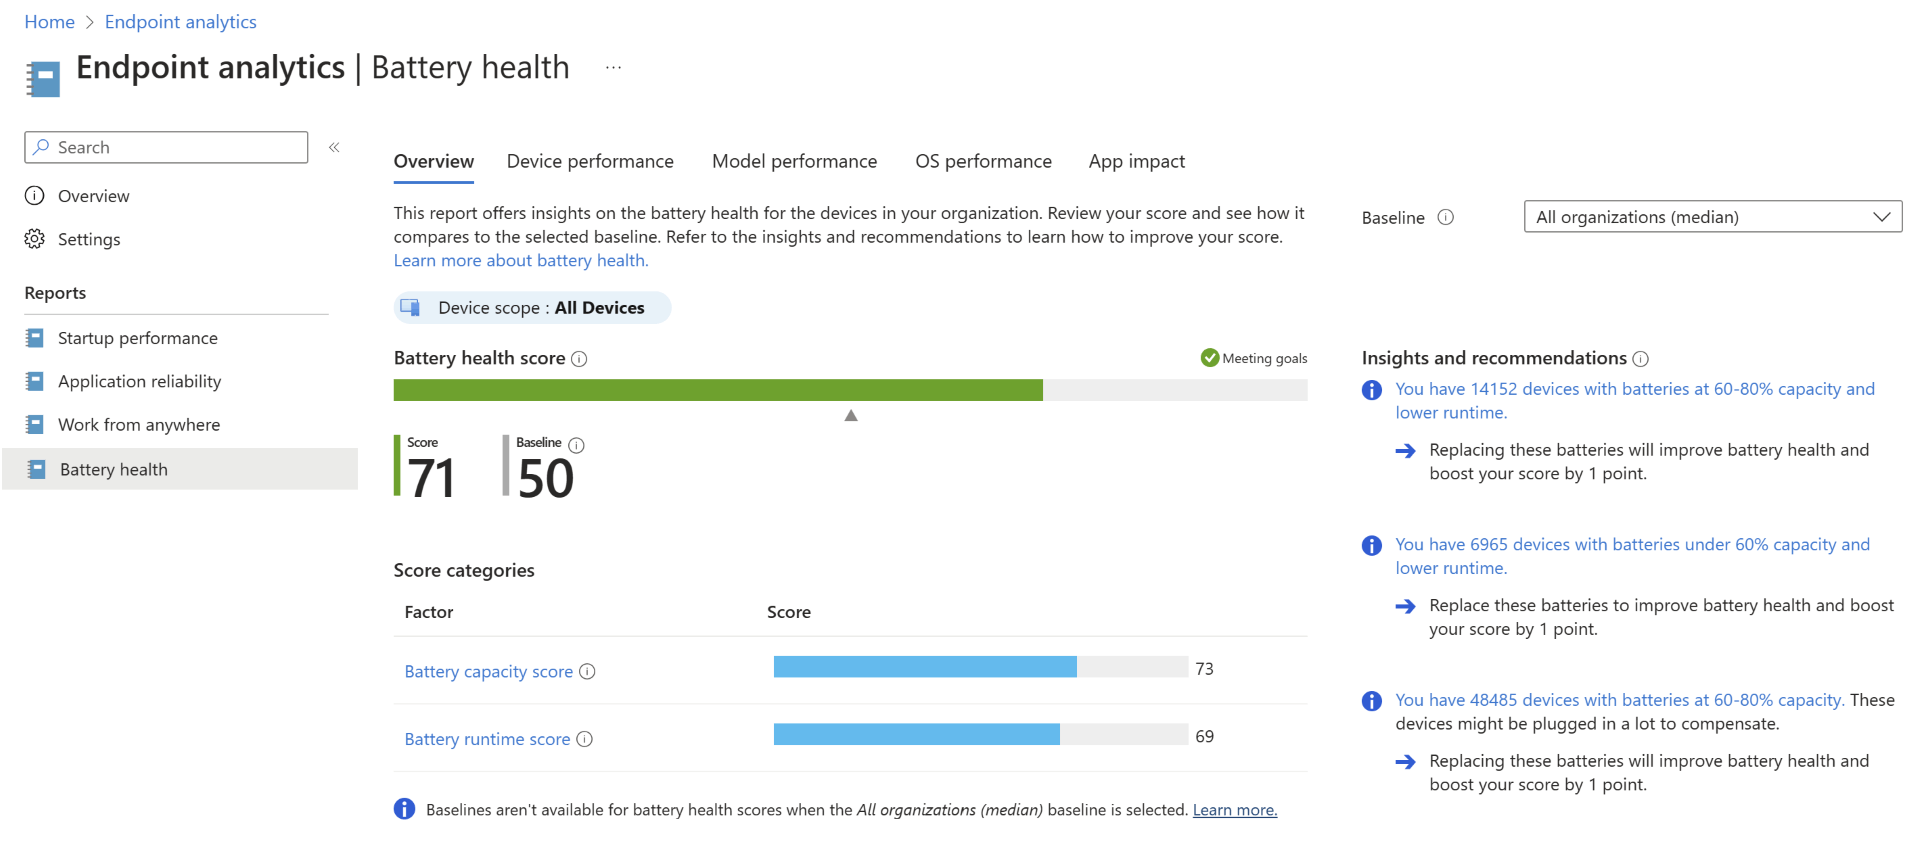
The battery health report gives you a clear look at how your device batteries are doing and how they might be affecting your users experience.
It helps you spot problems with the battery early on, so you can fix them before they get worse.
- Open the Intune admin center → Reports → Endpoint analytics → Battery health.
- The Battery health report page shows the following tabs:
- Overview tab:
- Battery Health Score: Shows overall laptop battery health as a weighted average of battery capacity and runtime scores. Helps you spot batteries that may need replacement. Maximum capacity is the ratio of current full charge to original design capacity.
- Battery capacity score: Rates battery capacity from 0 to 100, averaged across all devices. Estimated device runtime is how long a device runs on a full charge, based on typical usage. The battery capacity score combines current capacity and estimated drain rate.
- Battery runtime score: Reflects estimated device runtimes, scored averaged across all devices.
- Device performance tab: Shows battery health metrics and scores for all battery-powered devices. Sort by metrics (e.g., Max capacity) or search by device name to identify devices with poor battery health. Selecting a device displays its runtime trend, score compared to the model average, and top battery-consuming apps from the last 14 days. A battery’s cycle count increases each time it discharges a total of 100%, even if spread over multiple uses.
- Model performance tab: View battery health by device model to spot model-specific issues.
- OS performance tab: View battery health and scores by OS version to spot issues tied to specific OS releases.
- App impact tab: Shows battery usage by app over the last 14 days, helping identify apps that drain battery excessively.
- Overview tab:
Limitations
- Some report data may show as
Not availablein exported .csv files, these appear as-1. - Devices with batteries designed for low capacity will show low runtime and appear in low runtime insights. The only solution is to replace the battery with a higher-capacity one.
Resource Performance report
The resource performance report shows you how well your devices processors and RAM are working, and how that affects the experience of the people using them. It helps you spot hardware problems early on, so you can fix them before they escalate. You'll also see suggestions for when upgrading your CPU or RAM could make a real difference, and which devices might need attention before their warranties run out.
- Open the Intune admin center → Reports → Endpoint analytics → Resource performance.
- The Resource performance report page shows a Resource performance score tab, a Model performance tab and a Device performance tab.
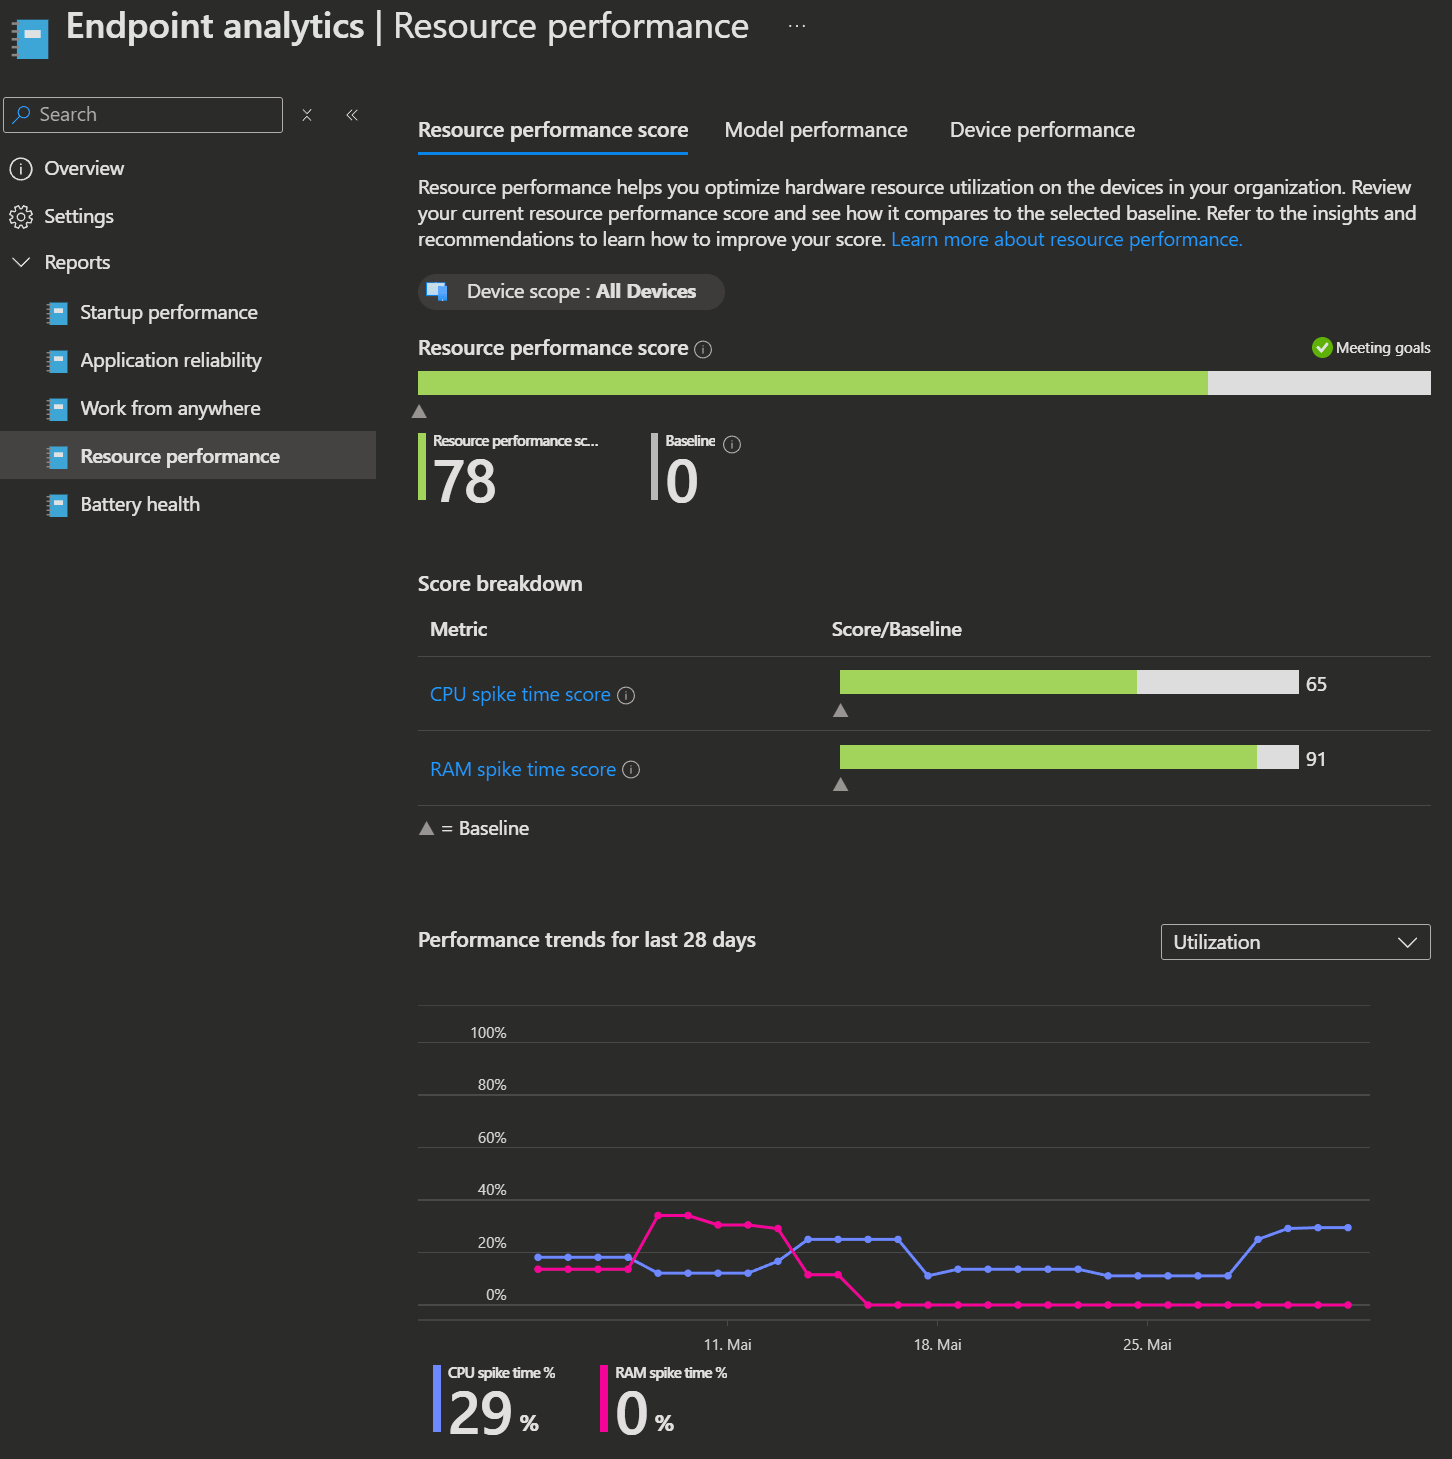
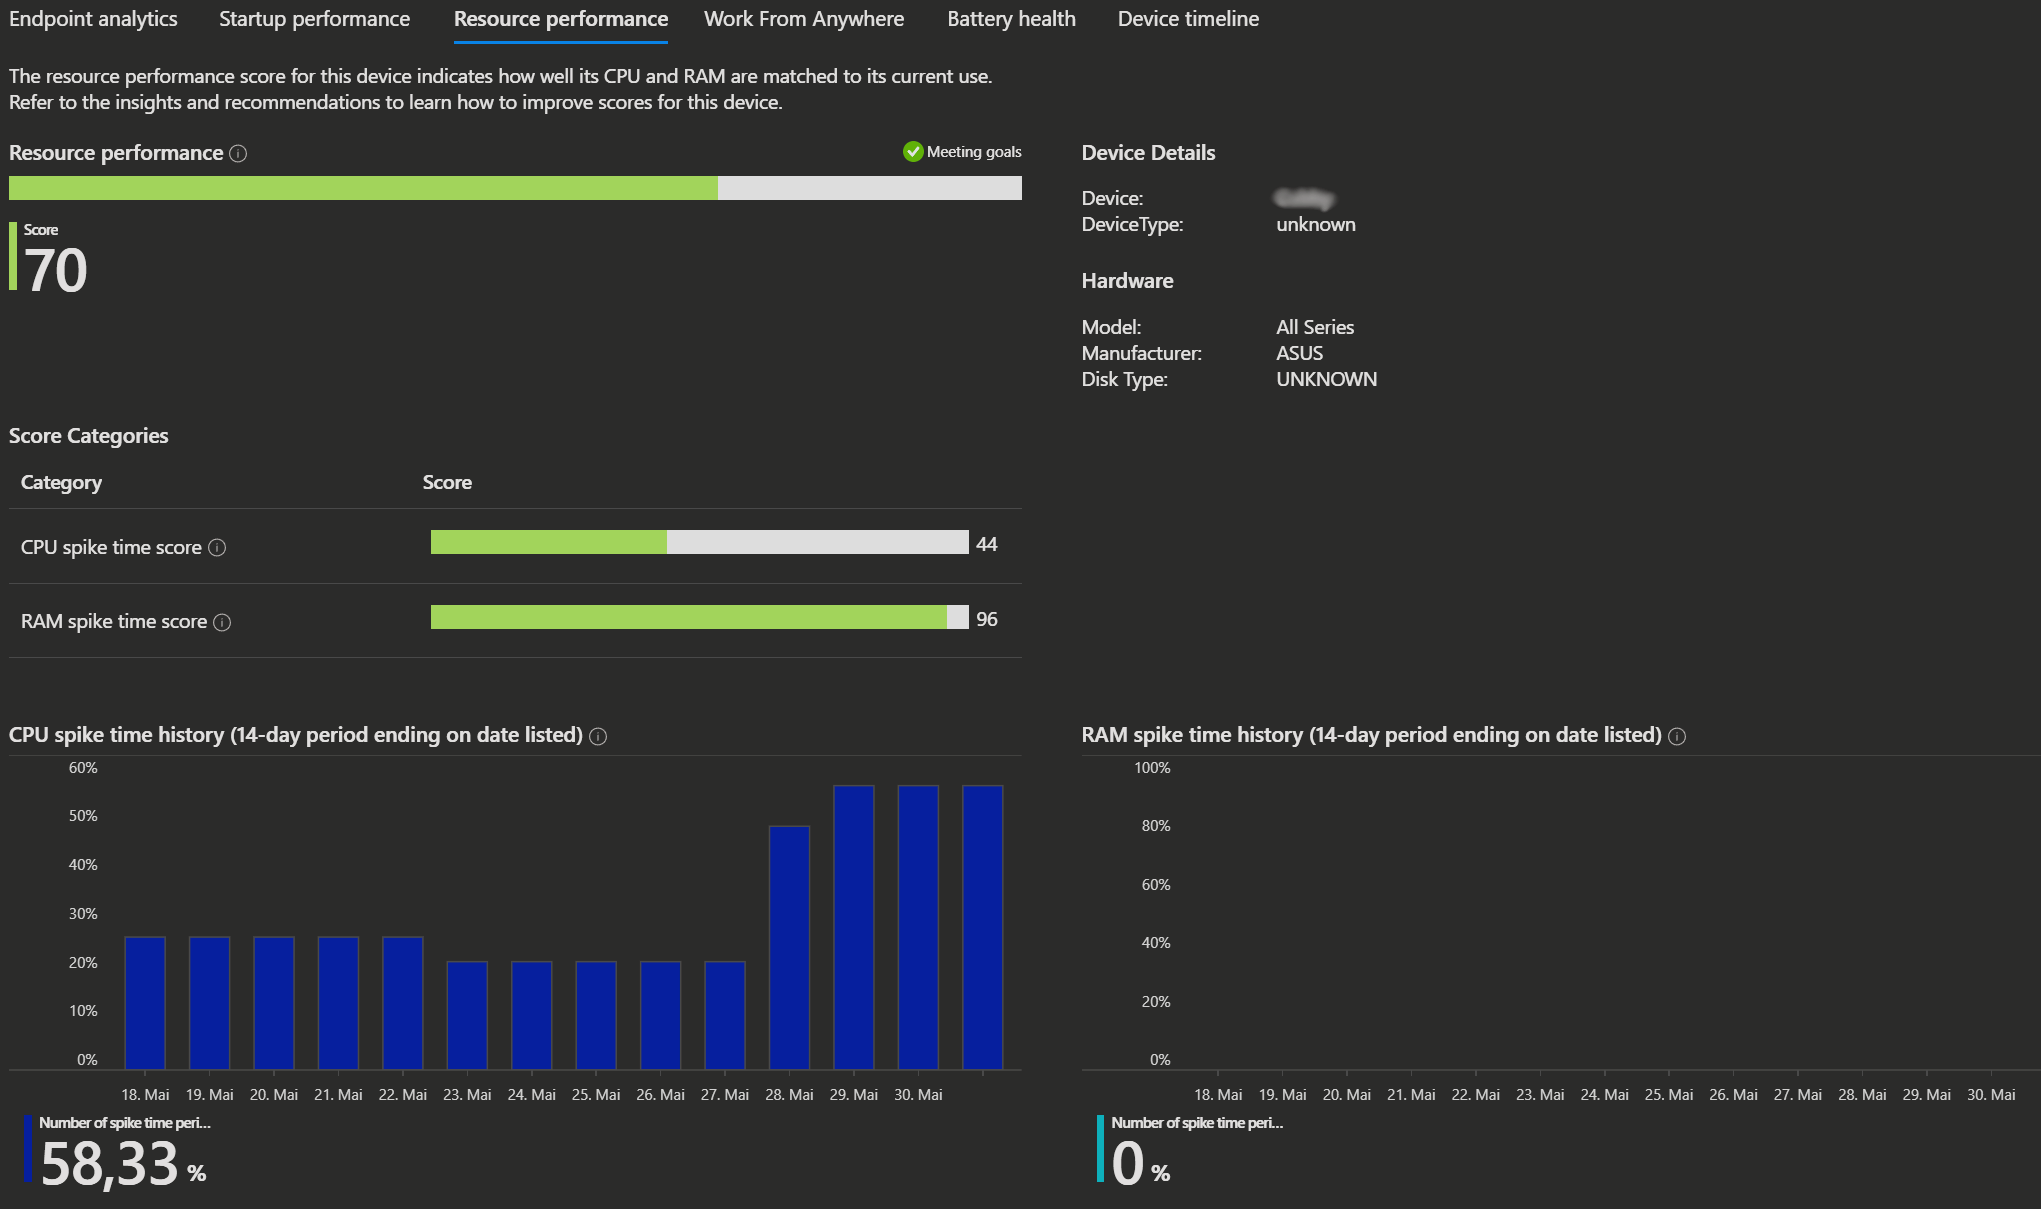
Resource performance score
The Resource Performance Score provides a quick overview (from 0 to 100 again) of how well your device's CPU and RAM are performing, whether it's a regular Windows PC or a Cloud PC. It’s based on a combination of your CPU spike time scores and RAM spike time scores, so you can easily see if your hardware is keeping up or needs attention.
CPU spike time score
The CPU Spike Time Score (0–100) indicates how frequently your device's CPU experiences heavy usage. Lower scores suggest more frequent spikes and potential slowdowns. A spike is counted when CPU usage exceeds 50% on average over the last 14 days. You can improve scores by upgrading your CPU, optimizing OS or power settings, or choosing a higher-spec Cloud PC.
RAM spike time score
The RAM Spike Time Score (0–100) indicates how frequently your device's RAM usage exceeds 75%. Lower scores suggest more frequent spikes and potential slowdowns. This report averages this figure over the last 14 days. You can improve scores by upgrading RAM or adjusting UEFI/BIOS settings for Windows devices, or by selecting a higher configuration for Cloud PCs.
Limitations
- Some data points in the report might show
--when not available. When you export the report, data points that aren't available appear as-1in the generated .csv file. - Health status appears differently in the report and the exported .csv
- HealthStatus .csv value:
- 0️⃣: Unknown
- 1️⃣: Insufficient data
- 2️⃣: Needs attention
- 3️⃣: Meeting goals
- HealthStatus .csv value:
- Some columns, such as
ResourcePerfScoreandTotalRamInMB, appear as typedoublein the exported .csv file, while the corresponding columns in the report Resource performance score and RAM are shown as typeint. - The
MachineTypecolumn in the .csv file can have valuesPhysical,CPC, andOthers, which correspond to Device Type values in the report asphysical,virtual, andunknown, respectively.
🗂️ Additional Intune reports
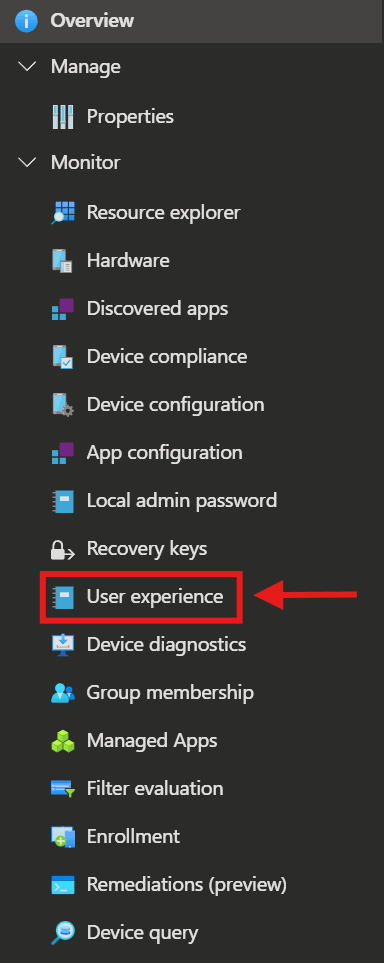
Device-level User experience
To find details on a specific Windows device, you can look in one of the Device-centred reports or select a device directly through the Intune admin Portal. You will find the User Experience blade there.
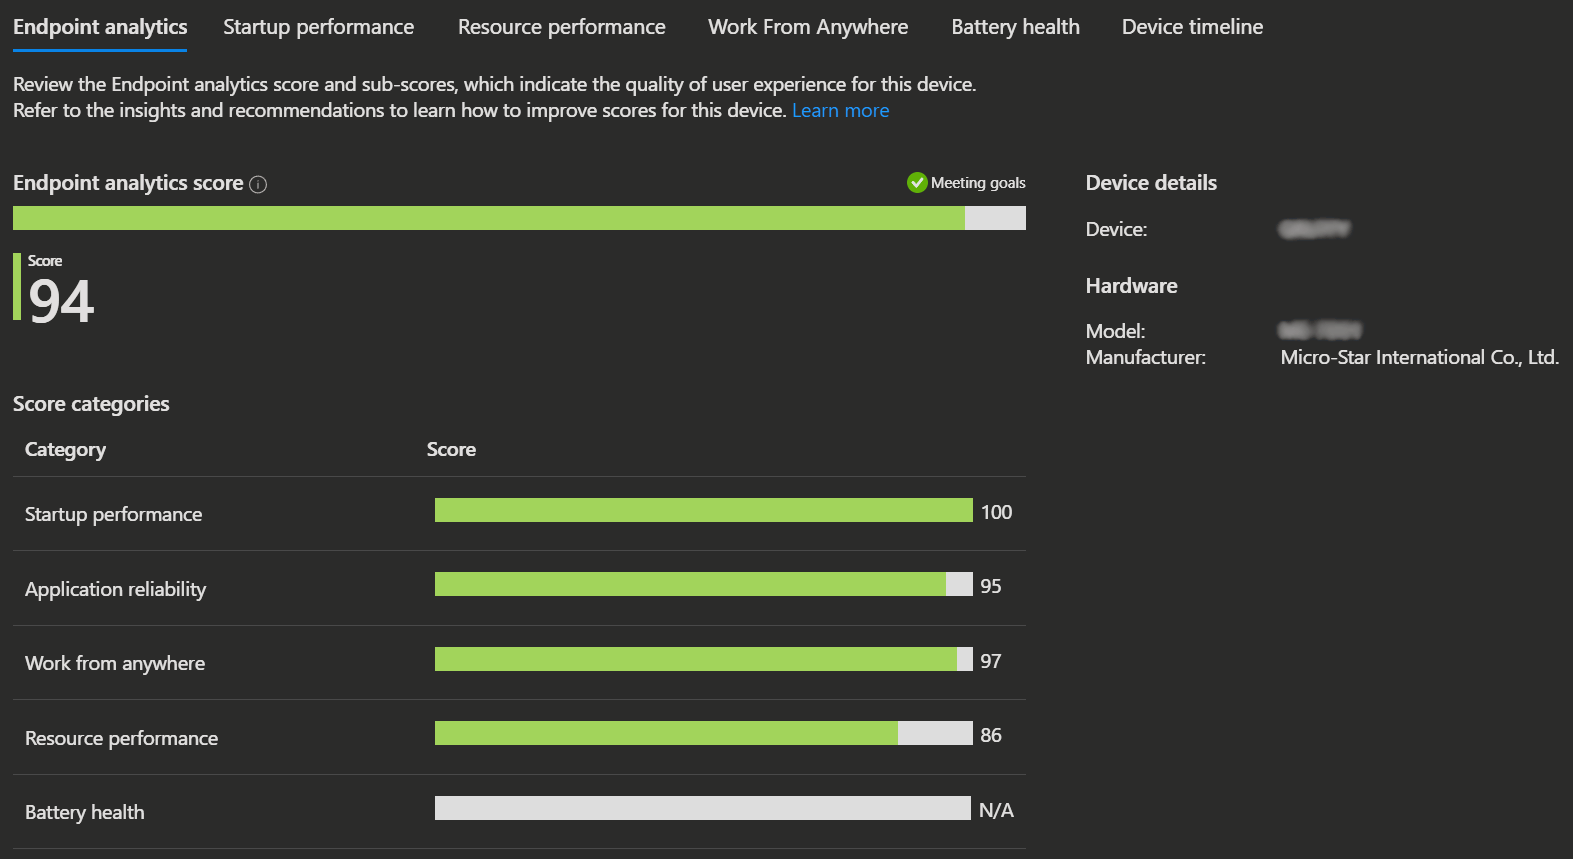
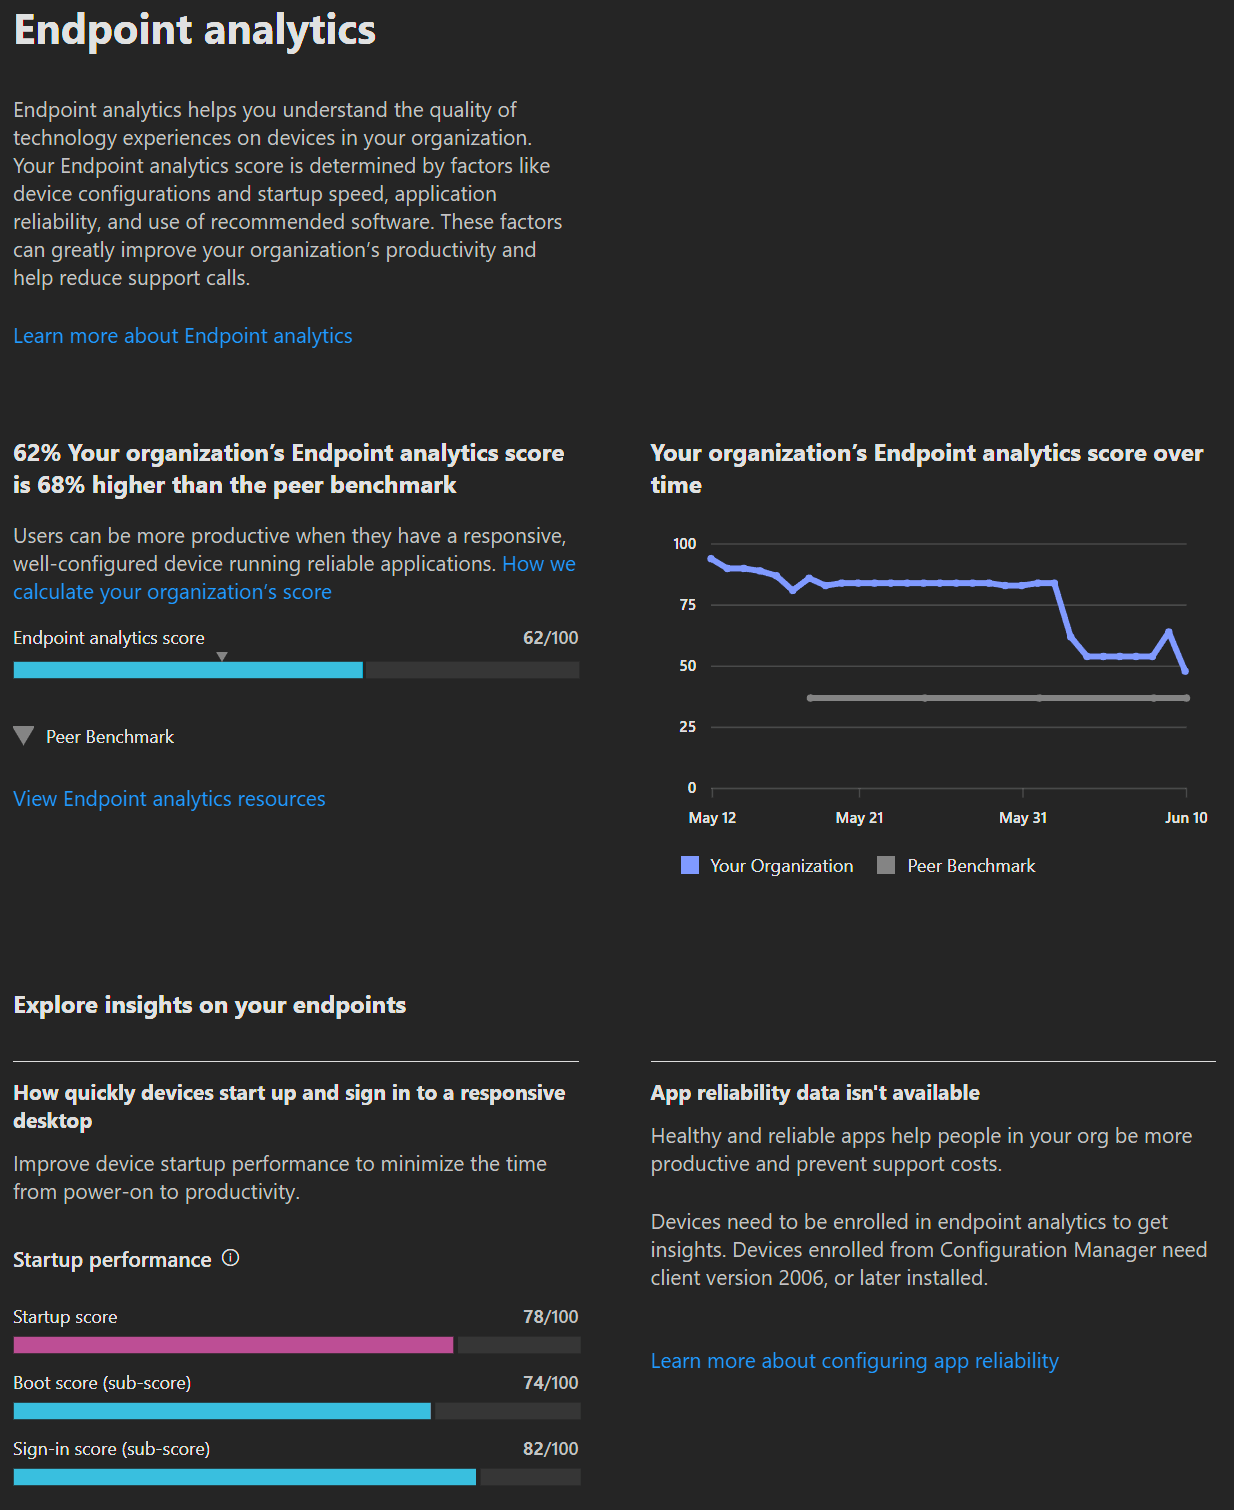
Endpoint analytics
The endpoint analytics blade shows you your general endpoint analytics score and an overview of the other scores.
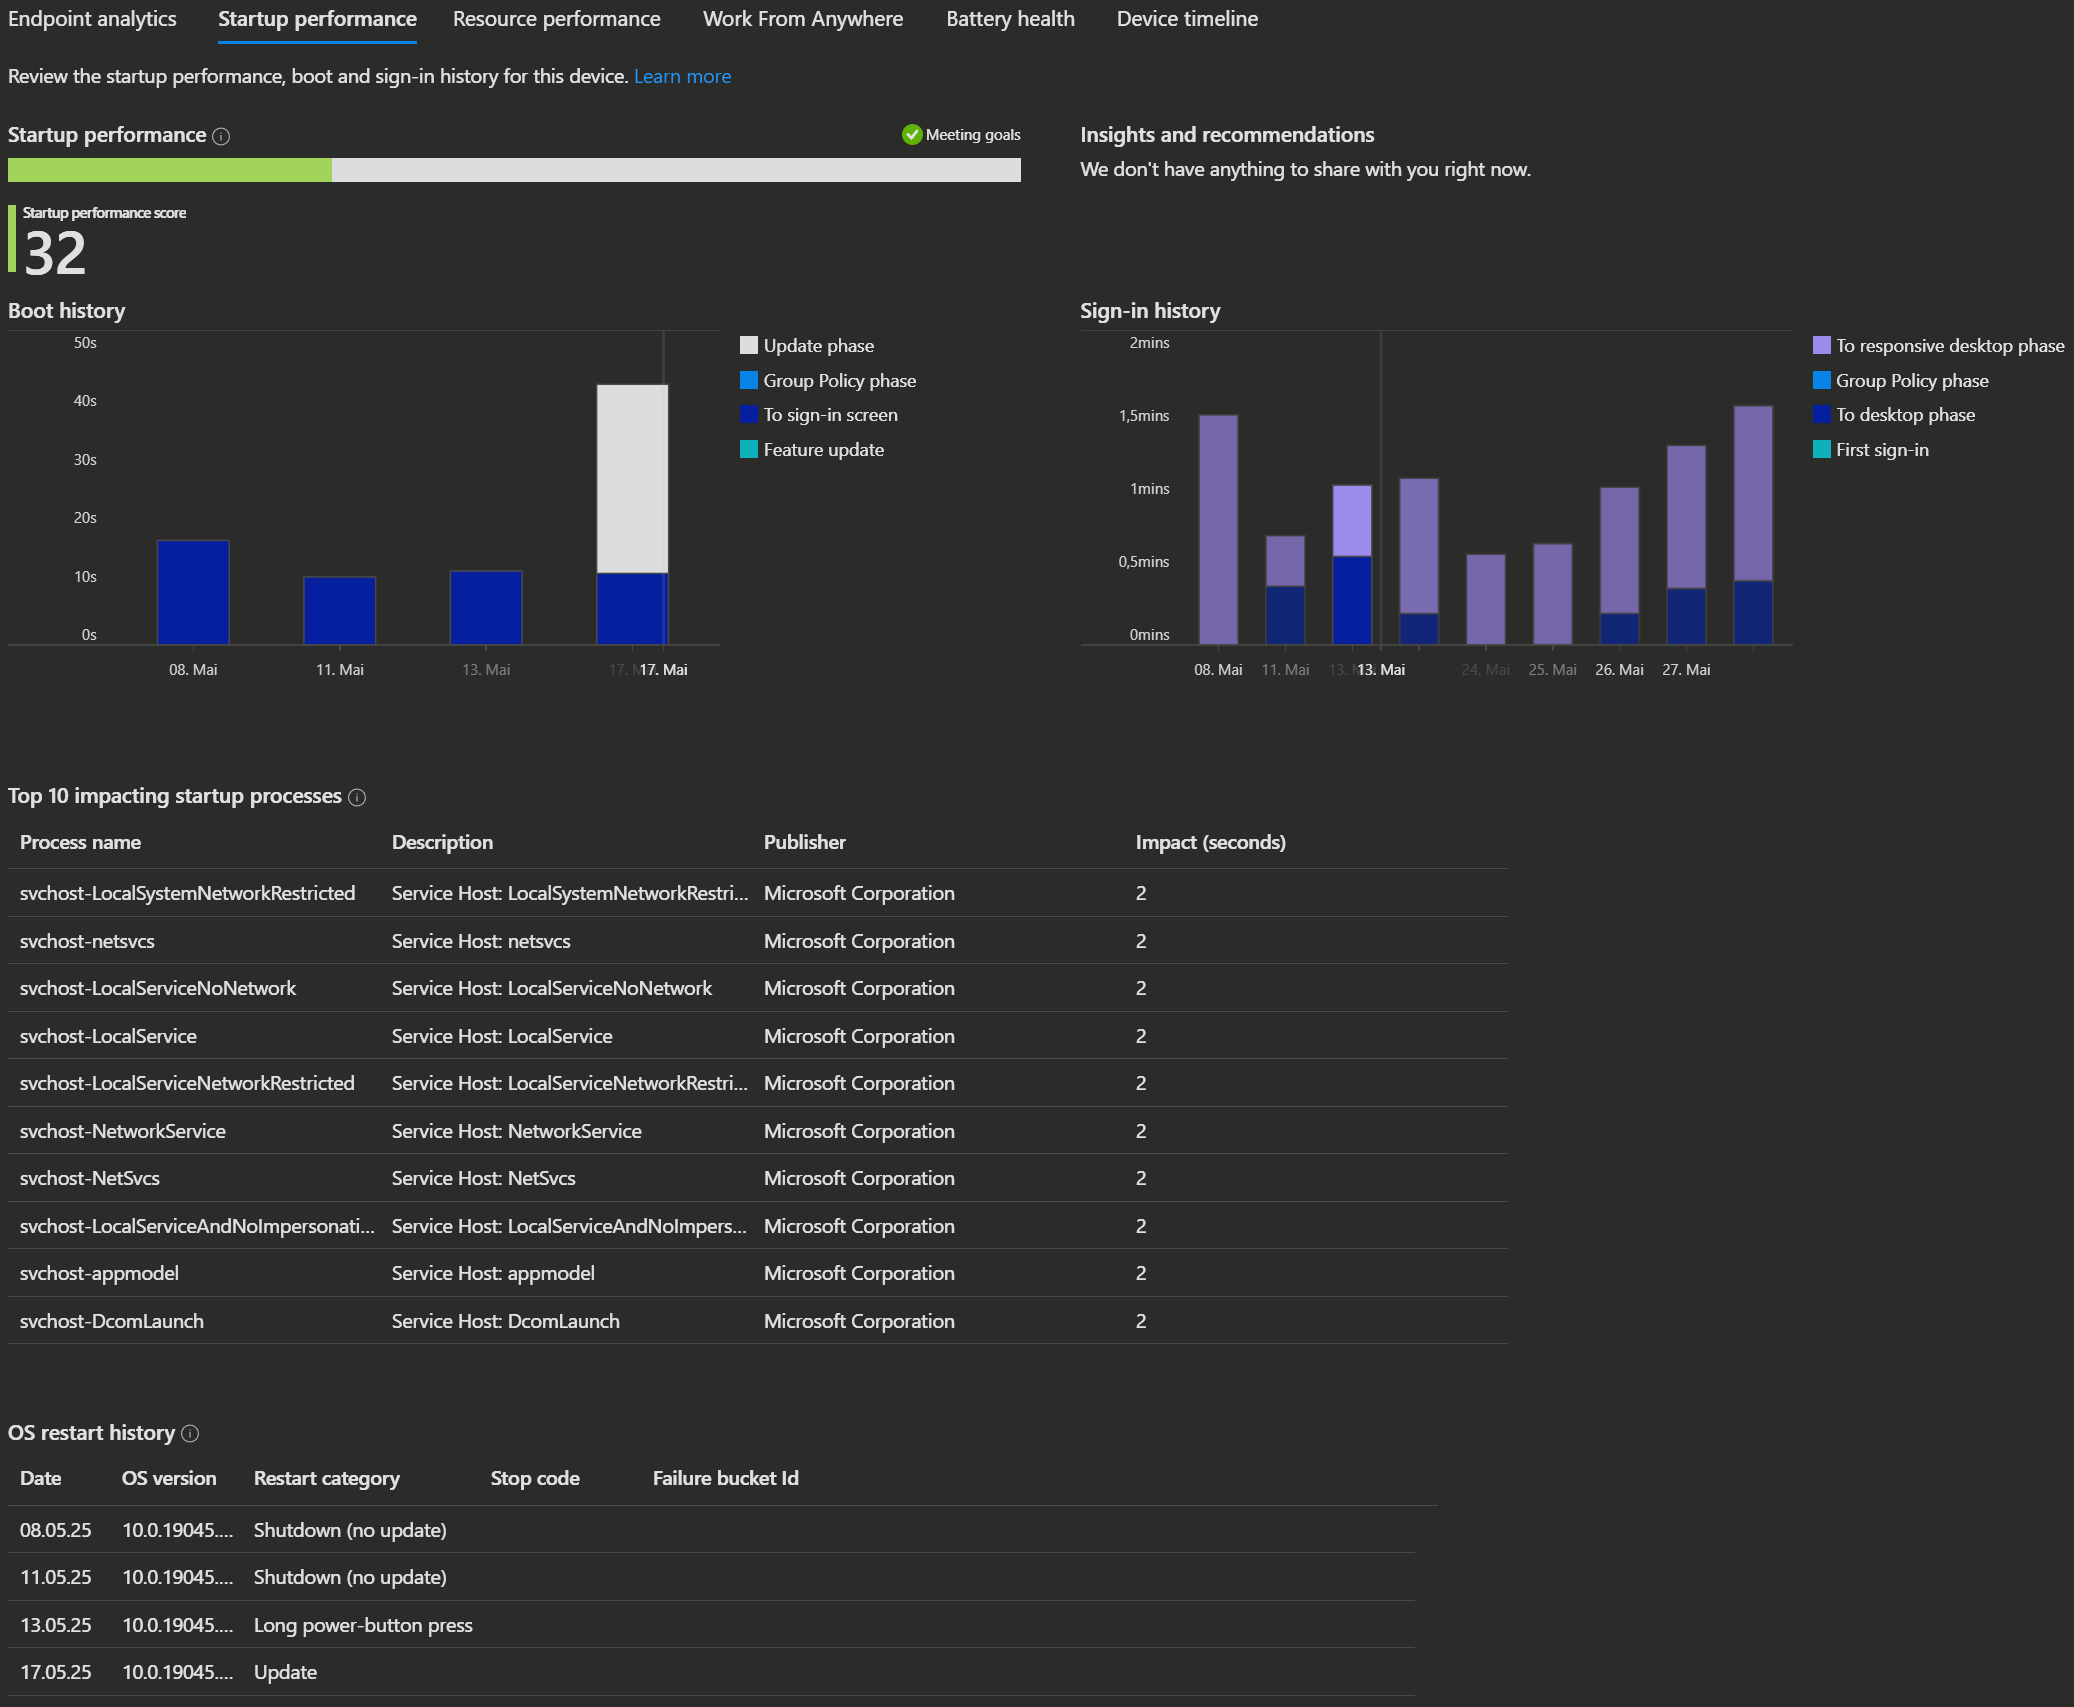
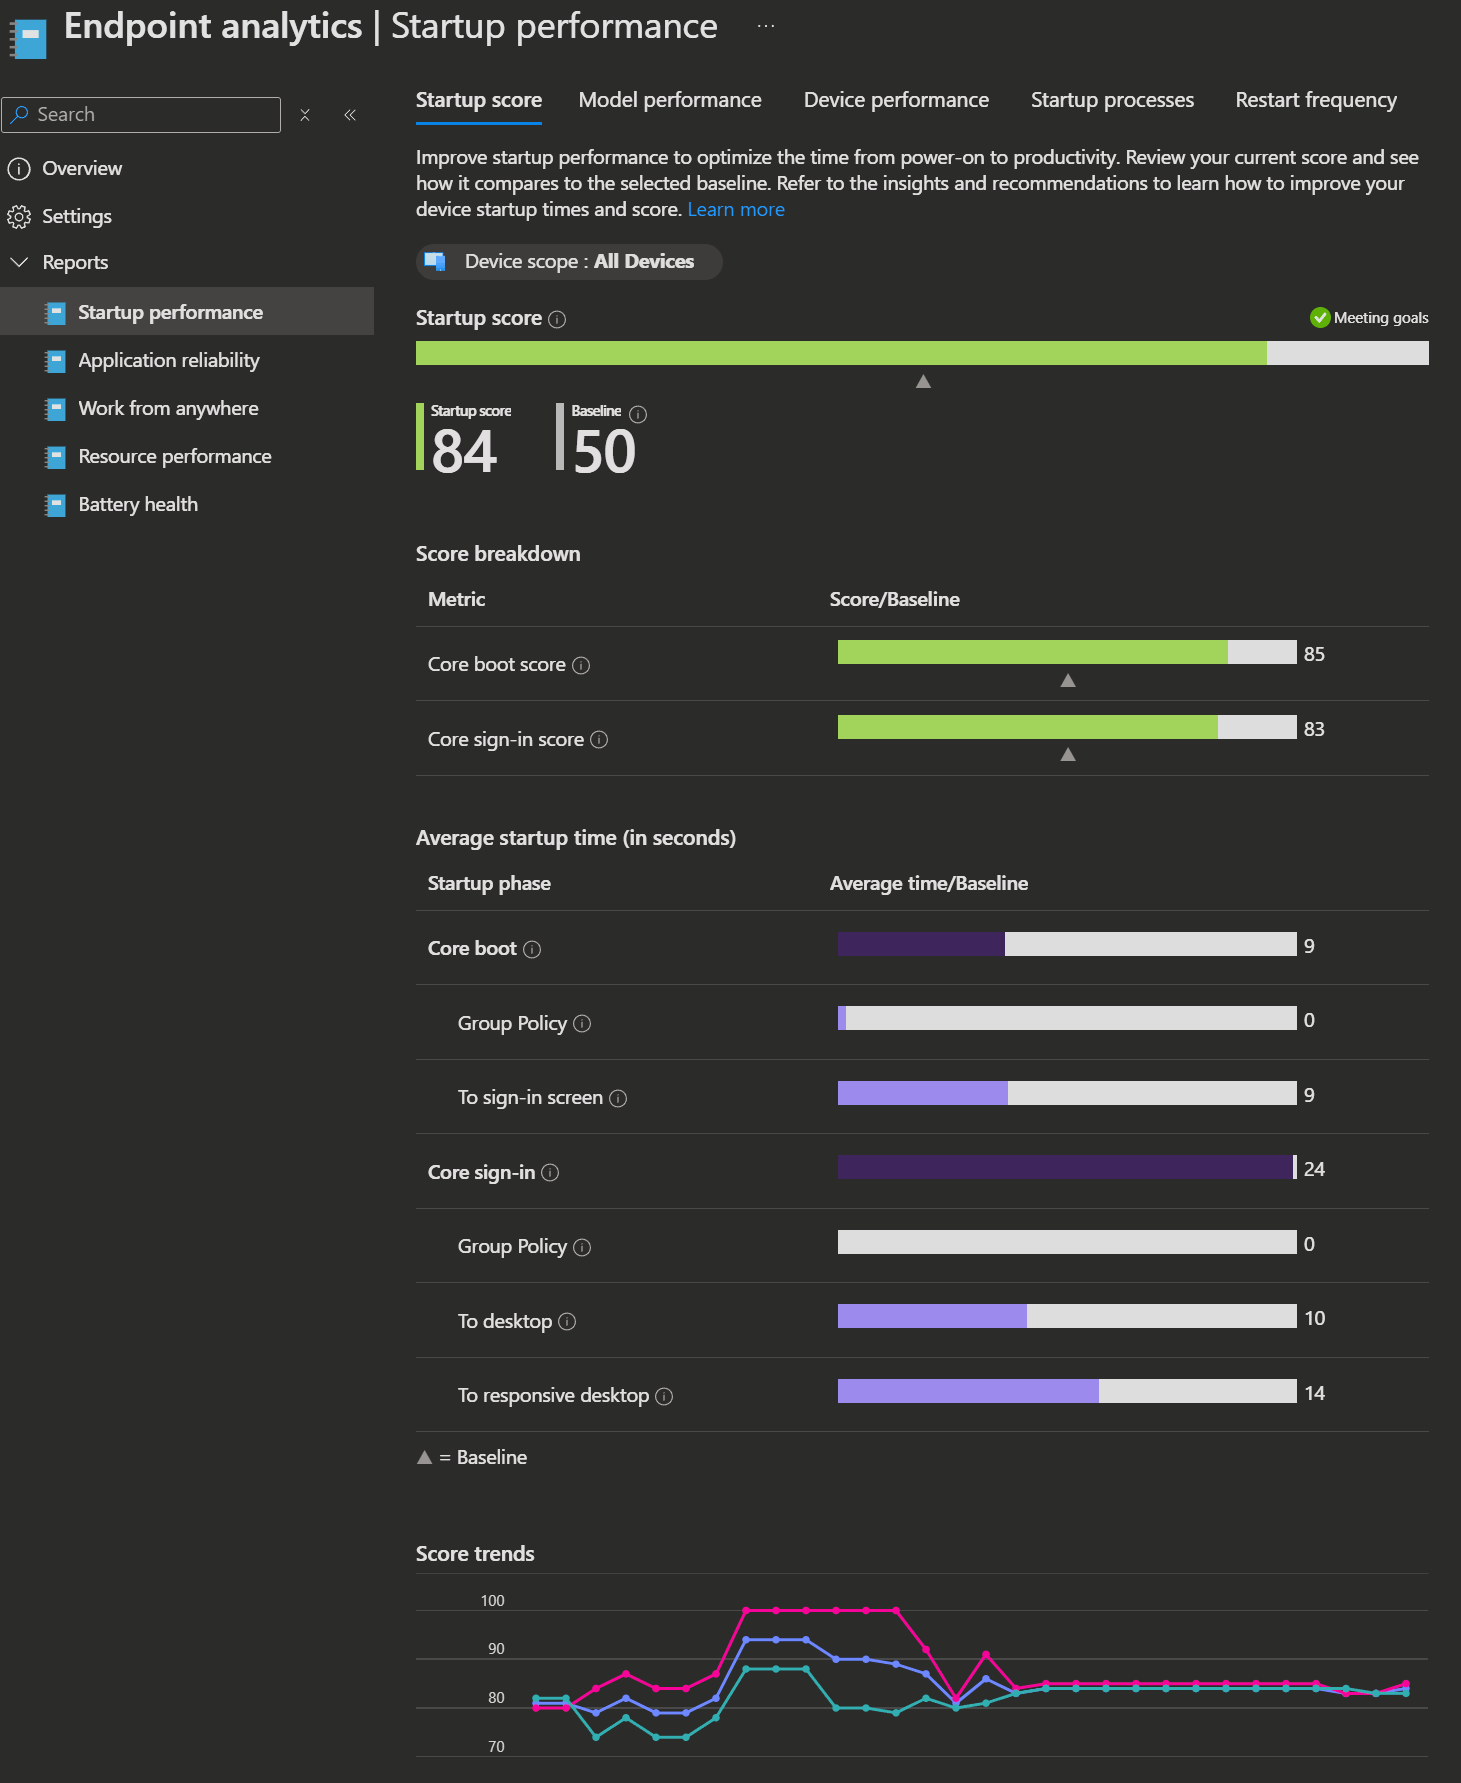
Startup performance
The Startup performance score (0–100) measures how quickly users go from power-on to a responsive desktop.
It combines:
- Boot score: Time from power-on to sign-in, averaged across devices.
- Sign-in score: Time from entering credentials to a usable desktop, averaged across devices.
Both scores help identify and address delays in the startup process.
INFO
You can find more information about known issues here.
Resource performance
For details on resource performance metrics, refer to the Resource Performance report section above.
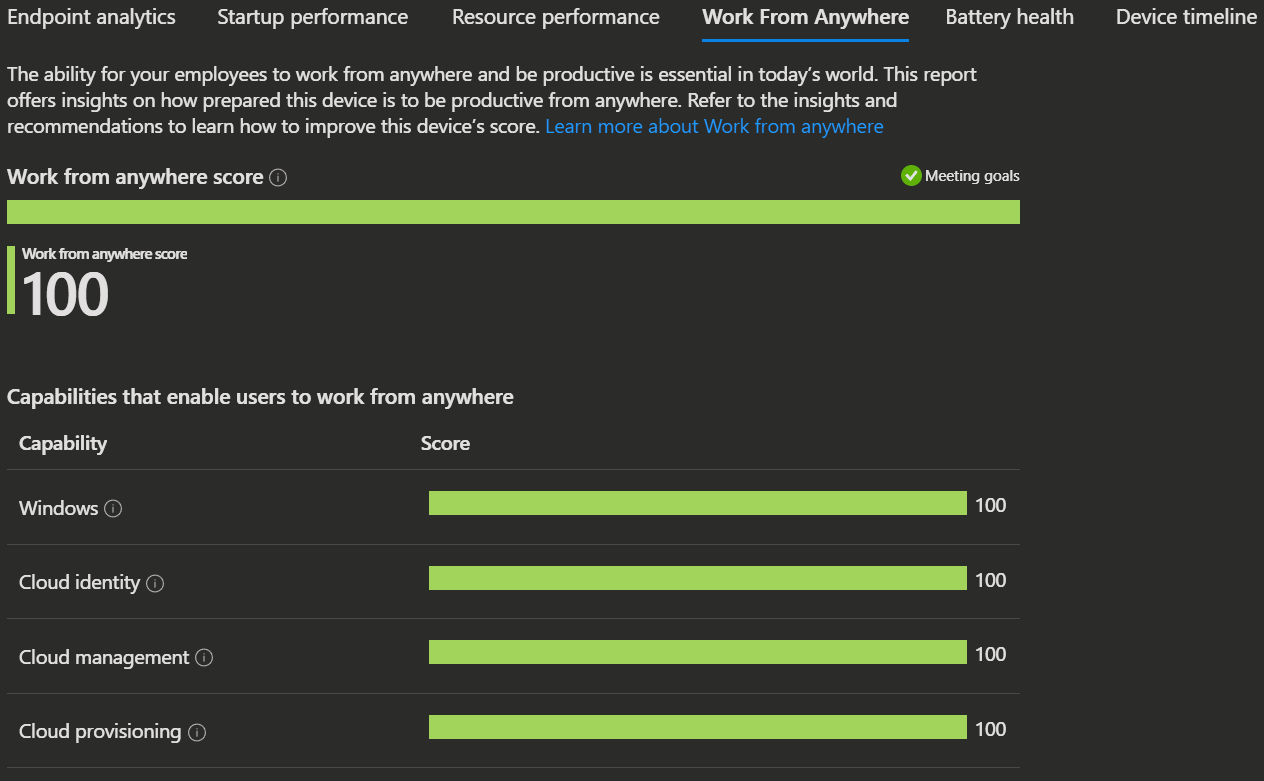
Work from Anywhere
The Work from Anywhere report shows how ready your organization is for remote productivity. It provides a score (0–100) based on the percentage of devices meeting key criteria:
- Windows version: Measures how many devices run supported Windows versions. Newer versions improve user experience.
- Cloud management: Tracks devices managed by Intune or Configuration Manager and connected to Microsoft 365 cloud services.
- Cloud identity: Shows the percentage of devices enrolled in Microsoft Entra ID or hybrid Entra ID for secure, seamless sign-in.
- Cloud provisioning: Measures devices provisioned using Windows Autopilot or as Windows 365 Cloud PCs for a streamlined setup.
A higher score means more devices are optimized for productive, secure work from anywhere.
INFO
You can find more information about known issues here.
Battery health
For details on battery health metrics, refer to the Battery health section above.

Device timeline
For details on the device timeline, refer to the Enhanced device timeline section above.
Standard Endpoint analytics reports
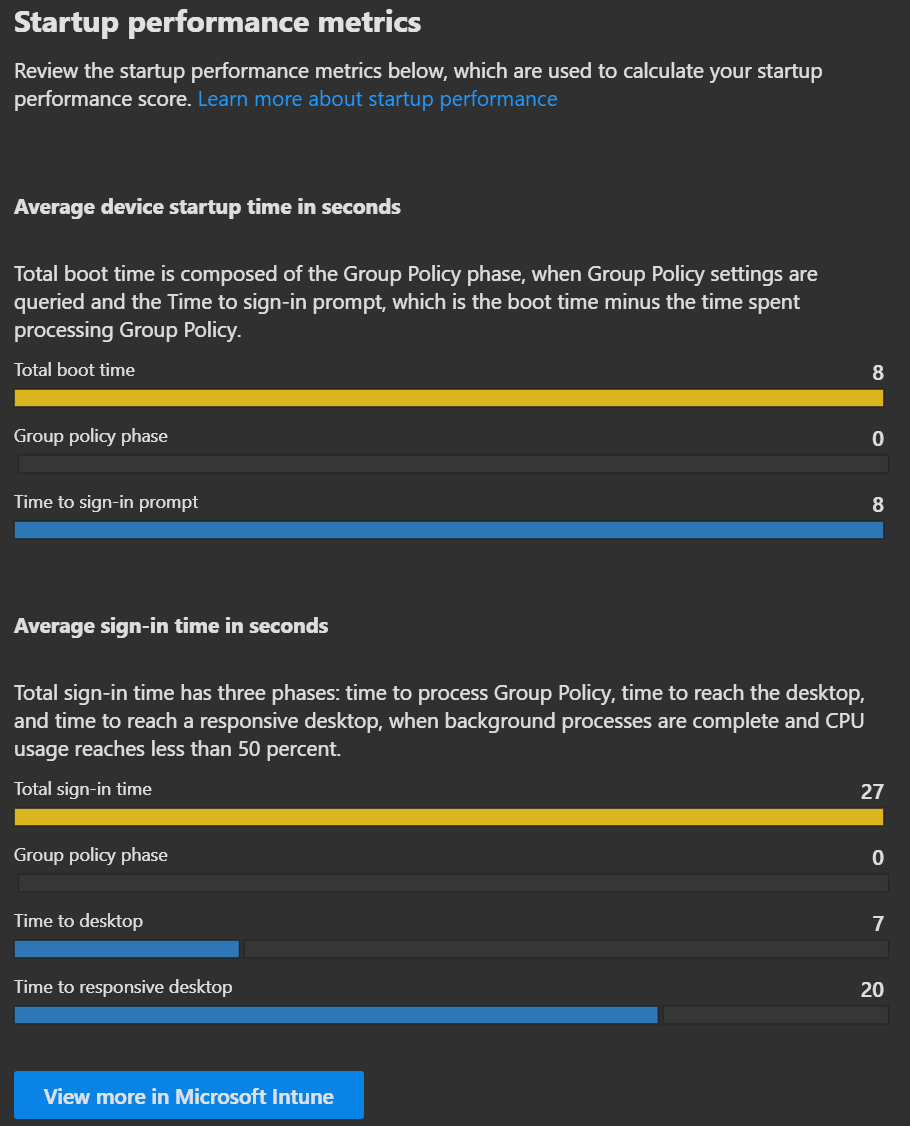
Startup performance
The Startup performance score (0–100) measures how quickly users go from power-on to a responsive desktop. It combines:
- Boot score: Time from power-on to sign-in.
- Sign-in score: Time from entering credentials to a usable desktop.
Both scores help identify and address delays in the startup process.
Reporting tabs:
- Model performance: View boot and sign-in performance by device model to spot model-specific issues.
- Device performance: See boot and sign-in metrics for all devices, sort by metric, and review individual device history.
- Startup processes: Identify processes that delay sign-in by keeping CPU usage high after desktop render. Shows device count, median delay, and total delay per process.
INFO
You can find more information about known issues here.
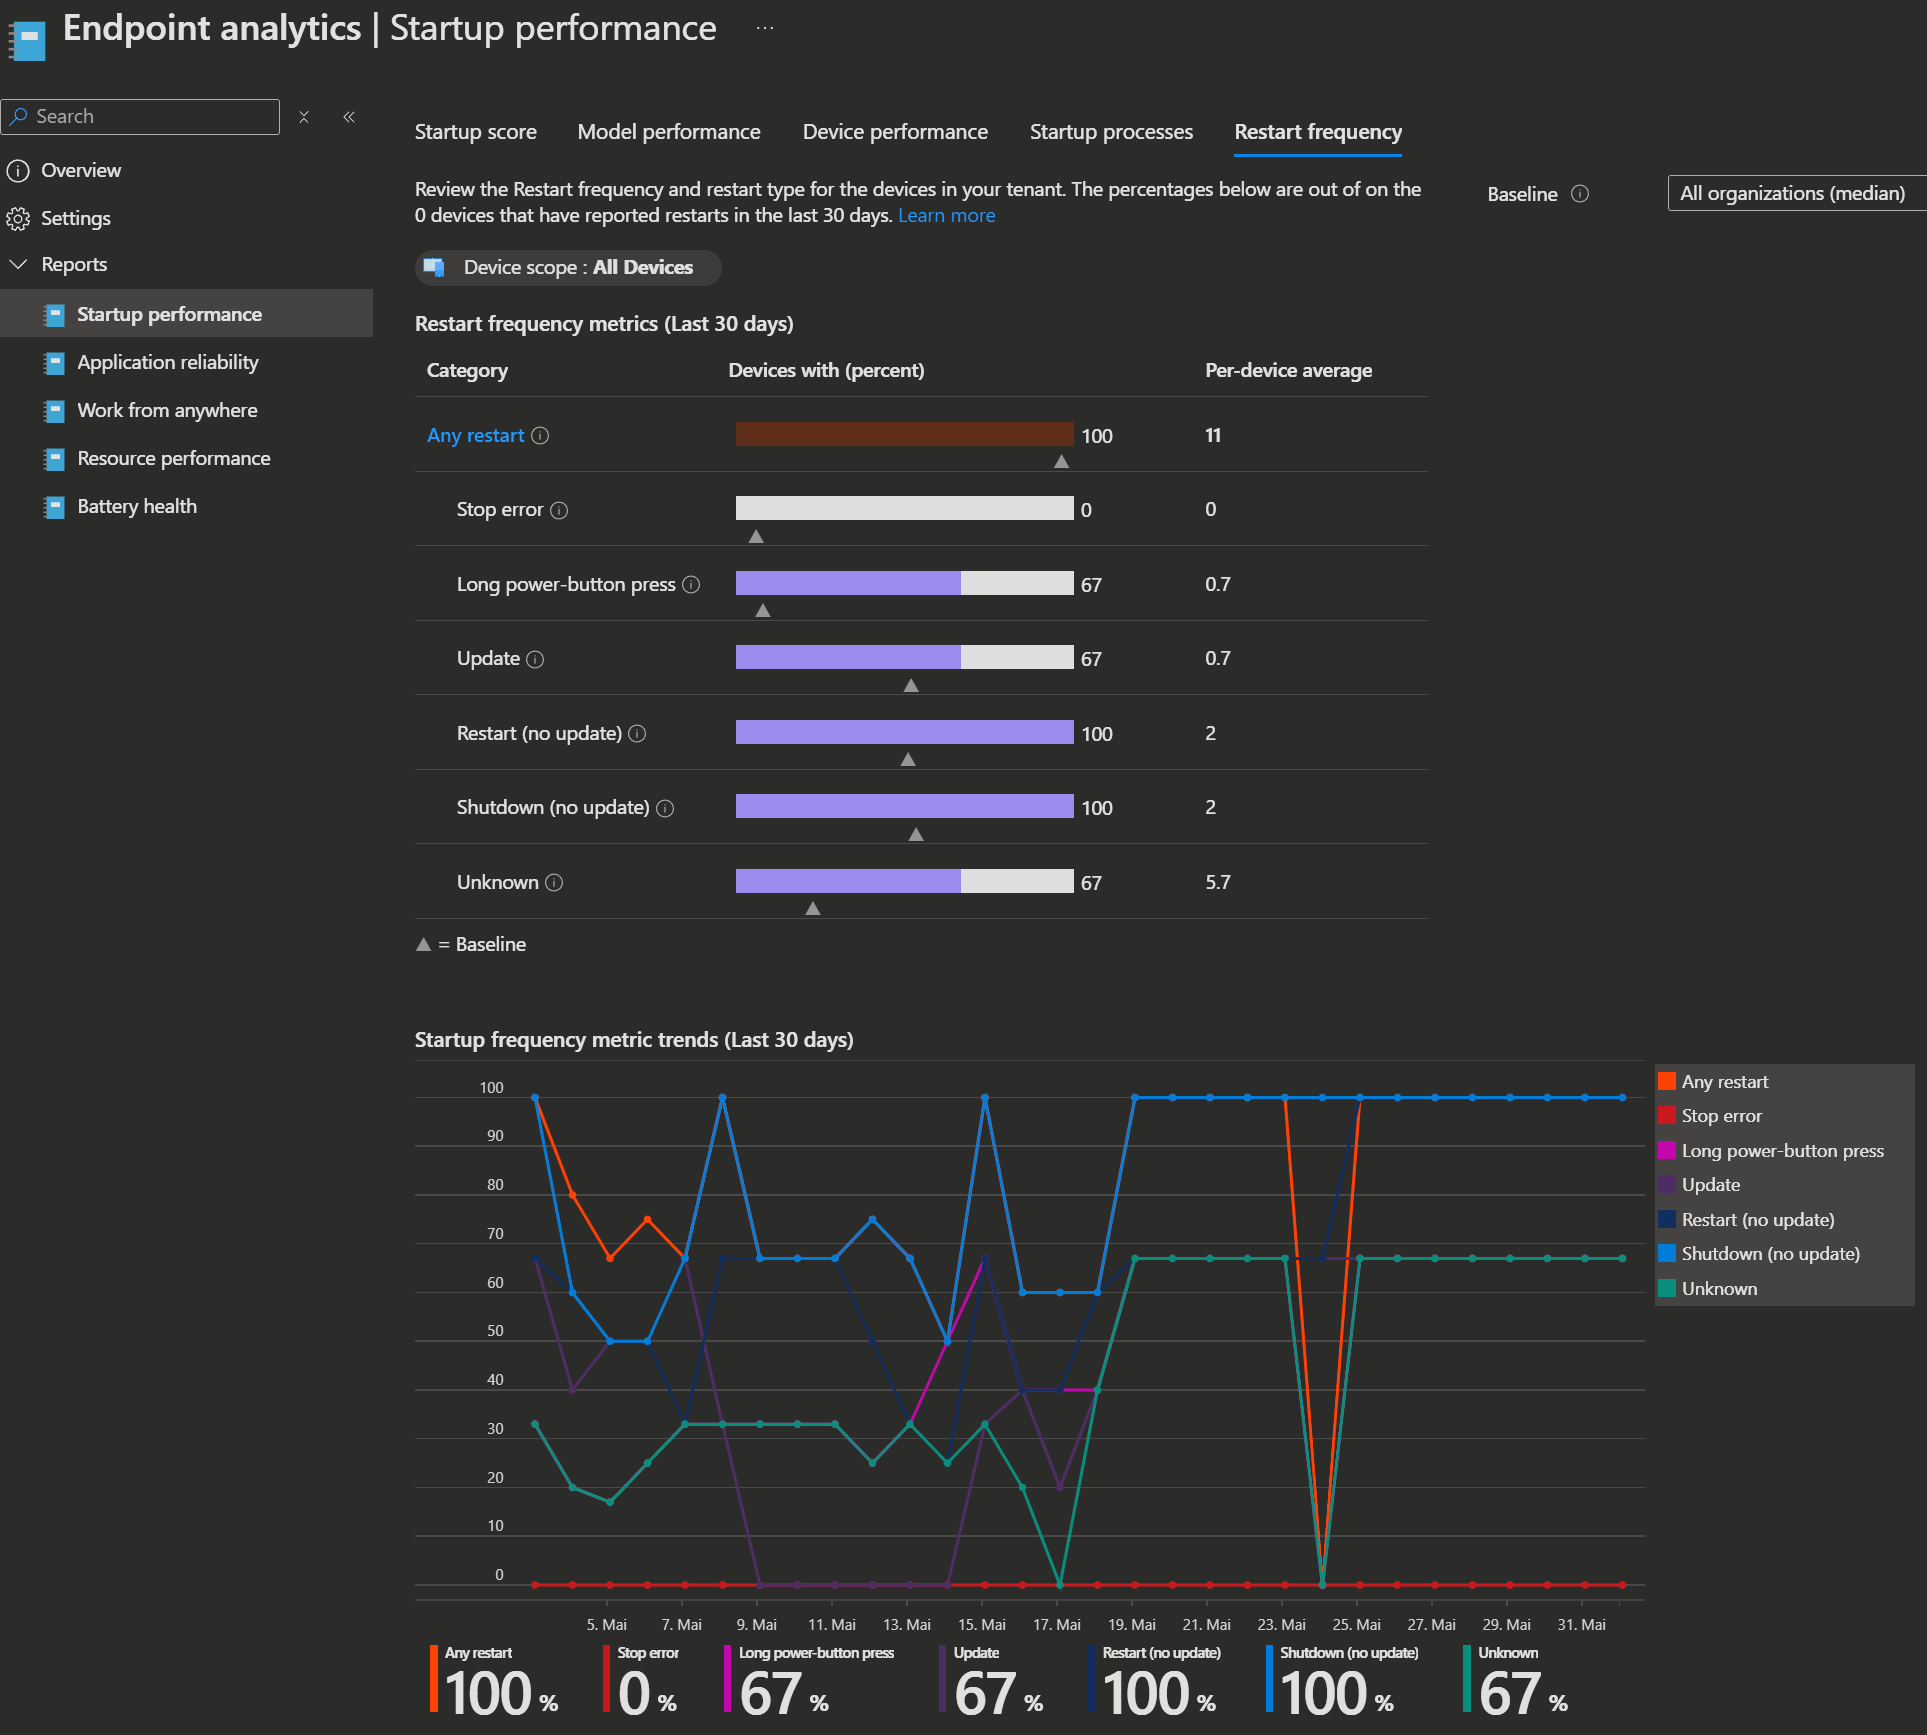
Restart frequency
Endpoint analytics includes insights into restart frequency, helping you spot devices with frequent reboots that may impact user experience.
Restarts are grouped into six categories:
- Abnormal shutdowns (unexpected restarts):
- Stop errors: Blue screen errors (should be rare, less than 2 per device per year).
- Long power button press: Forced restarts by holding the power button (should be even less frequent).
- Unknown: Other abnormal shutdowns.
- Normal shutdowns (normal restarts):
- Update: Restart to complete a Windows update (about one per device per month is ideal).
- Shutdown (no update): User-initiated shutdowns (daily).
- Restart (no update): Should be rare (ideally close to zero).
INFO
You can find more information about known issues here.
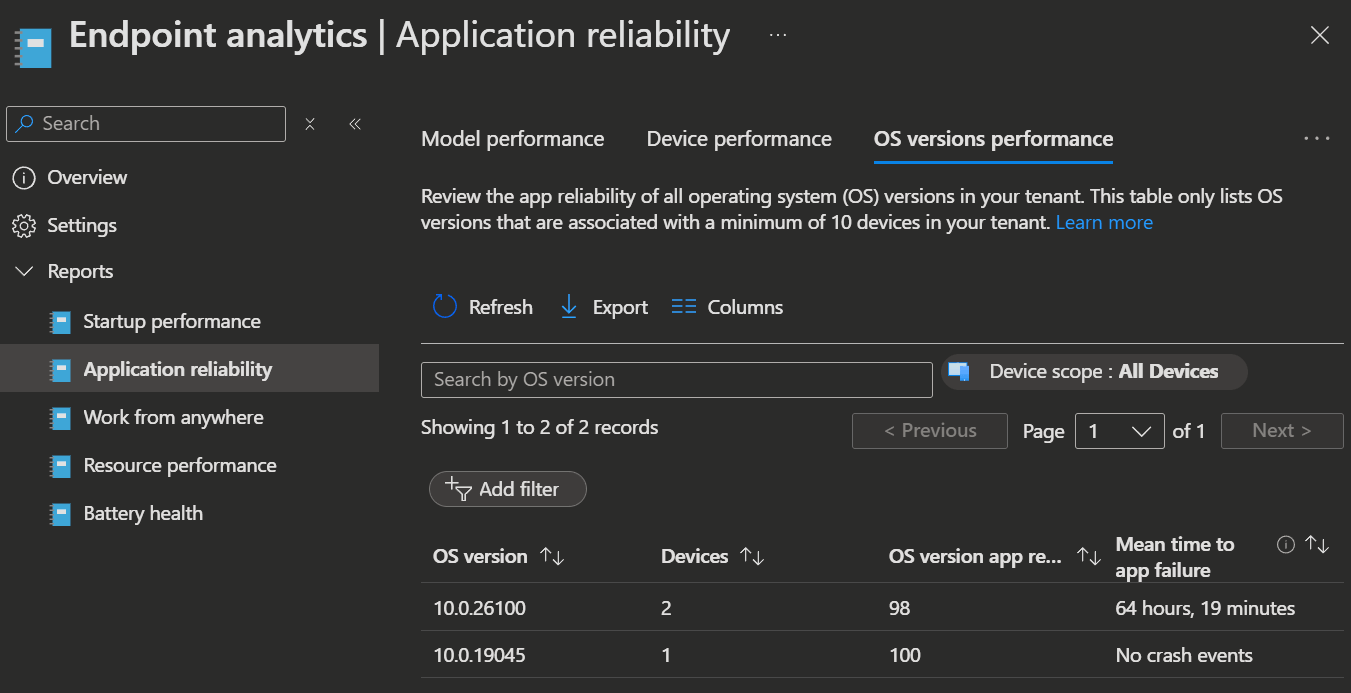
Application reliability
The application reliability report helps you quickly identify desktop apps that impact end-user productivity by showing aggregate usage and failure metrics. You can drill into specific device data and view app reliability events to troubleshoot issues.
IMPORTANT
As mentioned above, if you use Advanced Analytics, the App Reliability Score and App Performance tab are replaced with the enhanced Device Timeline tab. To view a device's application reliability score, go to the Device performance tab and search for the device.
App reliability score
This score (0–100) summarizes desktop app robustness across your environment, based on each app’s crash frequency and usage over the past 14 days.
App performance tab
Shows reliability insights for foreground apps with significant usage (active on >5 devices or >2% of enrolled devices). For each app, you’ll see:
- App name/publisher
- Active devices (14 days)
- Total usage duration (14 days)
- Total crashes (14 days)
- Mean time to failure (average usage time before a crash)
- App reliability score
App performance details
Select an app to compare crash counts and affected devices by app version or OS version, helping you pinpoint problematic versions or OS correlations.
Device performance tab
Shows app reliability insights per device, including total app crashes in the last 14 days. Selecting a device displays a timeline of app crash and unresponsive events (up to 14 days).
App crash events are limited to 10 per app, per device, per day.
INFO
You can find more information about known issues here.
Endpoint analytics in Microsoft Adoption Score
Endpoint analytics in Microsoft Adoption Score provides organizational-level insights into device performance, startup times, and application reliability, helping you identify and address issues that impact user experience. These analytics are visible to Adoption Score users, not just Intune admins, making it easier to drive improvements across your organization.
Key insights include:
- Current Endpoint analytics score and trends over 180 days
- Startup performance scores (boot and sign-in times)
- Application reliability metrics (top apps affecting reliability, mean time to failure, and active devices)
The Endpoint analytics score is a weighted average of Startup performance, Application reliability, and Work from anywhere scores.
 |  |
|---|
INFO
You can find more information about known issues here.
💡 Conclusion
Who would have thought there could be so much depth behind just a handful of reports and dashboards?
Advanced Analytics in Intune Suite goes far beyond simple charts, offering a wealth of insights, configuration options, and troubleshooting tools. Not only to watch current data, but also helping admins be more proactive when it comes to device health and reliability. By understanding all these features, you can truly unlock the value of your device data and deliver a better experience for your users.